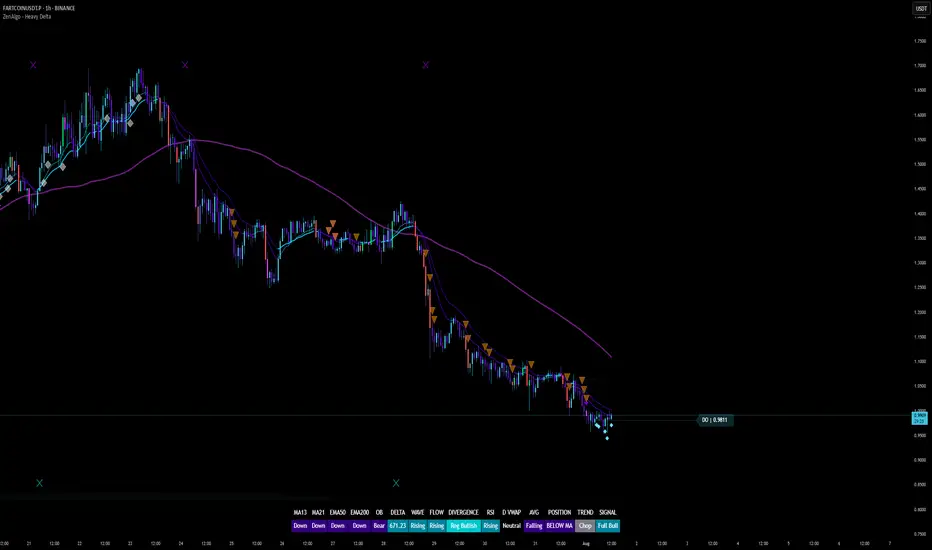
ZenAlgo - Heavy DeltaThe ZenAlgo - Heavy Delta indicator is a comprehensive technical analysis tool designed for traders seeking a deeper understanding of market dynamics. It combines multiple advanced sub-indicators, including Order Blocks, Moving Averages, VWAP, and Delta Volume analysis, and more to provide actionable insights. This indicator is particularly useful for identifying potential trade entries and exits based on institutional order flow and price action patterns.
Features
Order Block Detection: Identifies bullish and bearish order blocks with detailed visualization and volume analysis.
VWAP (Volume Weighted Average Price): Tracks the average price of a security weighted by volume over various anchor periods.
Moving Averages (MA): Customizable MAs (13, 21, 50, 200 periods) to detect trends and momentum shifts.
Daily Open and Monday Range: Highlights key levels like daily open and intraday/multi-day high-low ranges for better price context.
Delta Volume Analysis: Measures the net difference between buying and selling volume for market sentiment insights.
Divergence Detection: Detects regular and hidden bullish/bearish divergences for trend reversal opportunities.
Visual Alerts: Displays intuitive symbols for potential buy/sell signals and key price levels.
Added Value: Why Is This Indicator Original/Why Shall You Pay for This Indicator?
The ZenAlgo - Heavy Delta indicator offers a distinct advantage by integrating multiple analysis techniques into one cohesive tool. While many individual indicators are freely available, this script goes beyond simple overlays to provide an advanced analytical framework. Here’s why it stands out:
1. Synergy of Indicators
Order Blocks: These are not static; the indicator dynamically calculates zones where institutional activity likely occurred, supported by volume-weighted metrics.
Delta Volume Analysis: Freely available delta volume tools typically show raw data, but this script filters noise, categorizes volume into meaningful up/down segments, and integrates it with other signals for context.
VWAP and Moving Averages: VWAP and customizable MAs are enhanced with divergence checks, color-coded trends, and market state classifications. This integration helps confirm trends and reversals with higher precision.
2. Volume-Based Insights
Traditional volume indicators often fail to show the "intent" behind price moves. This script combines delta volume and order block data to highlight areas of significant buying or selling pressure and their potential impacts on future price action.
3. Visual Simplicity with Advanced Logic
Unlike using several separate tools, which can clutter your chart, this indicator presents a streamlined interface. Every plotted element serves a clear purpose, minimizing distractions while maximizing actionable insights.
4. Customized for Active Traders
The indicator doesn’t just provide standard calculations. It includes proprietary adjustments like mitigation thresholds in order blocks, percentage-based signals for VWAP, and delta volume intensity levels that align better with active market conditions.
5. Why Pay for It?
Time and effort savings: Instead of setting up and calibrating multiple tools, this indicator combines them into a single efficient package.
Enhanced accuracy: Each sub-indicator validates the others, reducing false signals.
Unique features: For instance, the script automatically adjusts for multi-timeframe inconsistencies and uses gradient color fills to convey volume strength in order blocks—a feature absent in free indicators.
How It Works
The indicator combines individual sub-indicators into a logical framework where each part contributes to the overall analysis. Here’s how each feature operates:
1. Order Blocks
Identification: Uses specific price action patterns to locate zones of likely institutional interest (bullish or bearish blocks).
Dynamic Updates: The blocks adjust as new price data comes in, ensuring their relevance. Volume within these zones is weighted, helping assess their strength and potential price reactions.
Visual Enhancements: Blocks are color-coded and filled with gradients based on volume intensity, providing immediate visual cues about their importance.
2. VWAP (Volume Weighted Average Price)
Calculation: Anchored to user-selected periods (daily, weekly, etc.), VWAP is recalculated in real-time, showing the "fair" price based on traded volume.
Integration: Acts as a dynamic support/resistance line, particularly useful in intraday and swing trading. Labels provide percentage deviation for quick interpretation.
3. Moving Averages (MAs)
Customization: Supports various types (EMA, SMA, etc.) and lengths (13, 21, 50, 200). Traders can configure these to suit their strategies.
Market Status: By comparing the price to these MAs, the indicator classifies the market as Full Bull, Bullish, Neutral, Bearish, or Full Bear. This high-level summary helps traders quickly gauge market sentiment.
4. Delta Volume
Core Logic: Calculates the net difference between buying and selling pressure (volume) for each candle.
Visual Signals: Plots symbols when significant delta volume changes coincide with other indicator signals, like divergence or order block activity.
5. Daily Open and Monday Range
Purpose: Identifies key psychological levels like the daily open and the high/low range for the first trading day of the week.
Context: Highlights these levels with dynamic percentage changes, helping traders understand how price is behaving relative to them.
6. Divergence Detection
Logic: Tracks discrepancies between price movement and momentum (via Moving Averages, Delta Volume, and Order Blocks). These divergences often precede reversals.
Validation: Divergences are only flagged when other features, like delta volume shifts or order block interactions, confirm the setup.
By combining these tools in a meaningful way, ZenAlgo - Heavy Delta transforms raw data into actionable intelligence, giving traders a comprehensive view of market dynamics and a significant edge in decision-making.
Why Use Heikin Ashi for Heavy Delta?
The ZenAlgo - Heavy Delta indicator is optimized for Heikin Ashi (HA) candles, which smooth out market noise and make trends more visually apparent. Heikin Ashi works best for this strategy for several key reasons:
Why Heikin Ashi Works Best
Trend Clarity: Unlike traditional candlesticks, Heikin Ashi averages price data to create smoother transitions. This helps the indicator better identify sustained trends and reduces false signals caused by short-term price fluctuations.
Noise Reduction: HA candles filter out minor fluctuations and emphasize the overall market direction, making it easier to align the indicator’s signals (like Delta Volume and Order Blocks) with larger market movements.
Improved Visual Insights: Features like Order Blocks and Delta Volume align well with Heikin Ashi's smoothed representation, as it avoids the erratic movements that traditional candles sometimes display.
Better Support for Trend Strategies: Heikin Ashi candles naturally highlight key reversals and continuation patterns, which complement the analytical goals of this indicator.
Important Notes About Heikin Ashi:
Synthetic Nature of HA Candles: Heikin Ashi values are calculated differently than traditional candles. For example: a) The open is the average of the prior candle's open and close. b) The close is the average of the high, low, open, and close. This synthetic nature means that HA candles do not reflect actual market prices but rather smoothed averages, which can slightly lag real-time price movements.
Lagging Effect: Because HA candles use averaged data, they can lag behind actual price action. This is beneficial for identifying trends but less effective for precise entry/exit timing.
Inaccuracy in Low Volatility: In low-volume or low-volatility conditions, HA candles may distort actual price dynamics, leading to less reliable insights.
No Direct Alerts or Buy/Sell Signals : Issuing explicit buy or sell signals based on Heikin Ashi candles is not possible due to their averaged, synthetic nature. As such, the ZenAlgo - Heavy Delta indicator does not generate direct trading signals. Instead, the indicator is a decision-support tool that provides insights into trends, volume dynamics, and potential key levels, leaving trade execution to the trader's discretion.
Usage Examples
Trend Confirmation: Use the MA market status to identify if the market is in a Full Bull or Bear state.
Reversal Zones: Monitor order block zones for price rejection or absorption, signaling a potential reversal.
Breakout Trading: Trade breakouts when price surpasses VWAP or Monday Range highs/lows.
Delta Divergence: Look for positive/negative delta volume divergences during consolidations for breakout cues.
Mean Reversion: Use VWAP or MAs as dynamic support/resistance for mean reversion setups.
Intraday Scalping: Utilize daily open and intraday levels for short-term trades.
Swing Trading: Employ order blocks and multi-day ranges to frame swing trade setups.
Volume Climax: Identify volume spikes using Delta Volume to confirm trend continuation or reversal.
Momentum Trading: Combine divergence signals with Delta Volume for high-conviction entries.
Risk Management: Use defined order block boundaries to set stop losses and targets.
Settings
Order Blocks: Customize label visibility, label offsets, and block appearance.
VWAP: Adjust anchor period and toggle visibility.
Moving Averages: Configure length, type (EMA, SMA, etc.), and visibility of MAs (13, 21, 50, 200).
Delta Volume: Enable/disable delta symbols and labels, adjust sensitivity multipliers.
Daily Open/Monday Range: Toggle visibility and customize display preferences.
General Visuals: Adjust label offsets, color schemes, and transparency.
Important Notes
This indicator is a technical analysis tool and does not guarantee trading success.
Use it in conjunction with other indicators and fundamental analysis for a more comprehensive trading strategy.
Performance may vary in low-liquidity markets or during sudden news events.
Divergence signals might fail in strongly trending markets.
Wyszukaj w skryptach "order block"
ICT Panther (By Obicrypto) V1 ICT Panther Indicator: Full and Detailed Description
The ICT Panther Indicator, created by Obicrypto, is an advanced technical analysis tool designed specifically for traders looking to identify key price action events based on institutional trading techniques, particularly in the context of the Inner Circle Trader (ICT) methodology. This indicator helps traders spot market structure breaks, order blocks, and potential trade opportunities driven by institutional behaviors in the market. Here's a detailed breakdown of its features and how it works:
What Does the ICT Panther Indicator Do?
1. Market Structure Breaks (MSB) Identification:
The ICT Panther identifies critical points where the market changes direction, commonly referred to as a break of structure (BoS). When the price breaks above or below certain key levels (based on highs and lows or opens and closes), it signals a potential shift in market sentiment. These break-of-structure points are essential for traders to determine whether the market is likely to continue its trend or reverse.
2. Order Blocks Visualization:
The indicator plots demand (bullish) and supply (bearish) boxes, which represent areas where institutional traders might place significant buy or sell orders. These zones, known as order blocks, are areas where the price tends to pause or reverse, giving traders key insights into potential entry and exit points. The indicator shows these areas graphically as colored boxes on the chart, which can be used to plan trades based on market structure and price action.
3. Pivot Point Detection:
The ICT Panther identifies important pivot points by tracking higher highs and lower lows. These pivot points are critical in determining the strength of a trend and can help traders confirm the direction of the market. The indicator uses a unique algorithm to detect two levels of pivot points:
- First-Order Pivots: Major pivot points where the price makes notable highs and lows.
- Second-Order Pivots: Smaller pivot points, useful for detecting microtrends within the larger market structure.
4. Bullish and Bearish Break of Structure Lines:
When a significant market structure break (BoS) occurs, the indicator will automatically draw red lines (for bearish break of structure) and green lines (for bullish break of structure) at key price levels. These lines help traders quickly see where institutional moves have occurred in the past and where potential future price moves could originate from.
5. Tested and Filled Boxes:
The ICT Panther also has a built-in mechanism to dim previously tested order blocks. When the price tests an order block (returns to a previous demand or supply zone), the box's color dims to indicate that the area has already been tested, reducing its significance. If the price fully fills an order block, the box stops plotting, providing a clear and clutter-free chart.
Key Features
1. Market Structure Break (MSB) Trigger:
- The indicator allows users to select between highs/lows or opens/closes as the trigger for market structure breaks. This flexibility lets traders adjust the indicator to suit their personal trading style or the behavior of specific assets.
2. Order Block Detection and Visualization:
- The tool automatically plots bullish and bearish demand and supply boxes, representing institutional order blocks on the chart. These boxes provide visual cues for areas of potential price action, where institutional traders might be active.
3. Second-Order Pivot Highlighting:
- The ICT Panther offers an option to plot second-order pivots, highlighting smaller pivot points within the larger market structure. These pivots can be helpful for short-term traders who need to react to smaller price movements while still keeping the larger trend in mind.
4. Box Test and Fill Delays:
- Users can configure delays for box tests and box fills, meaning the indicator will only mark a box as tested or filled after a certain number of bars. This prevents false signals and helps confirm that a zone is truly significant in the market.
5. Customization and Visual Clarity:
- The indicator is highly customizable, allowing users to turn on or off various features like:
- Displaying second-order pivots.
- Highlighting candles that broke structure.
- Plotting market structure broke lines.
- Showing or hiding tested and filled demand boxes.
- Setting custom delays for box testing and filling to suit different market conditions.
6. Tested and Filled Order Block Visualization:
- The indicator visually adjusts the tested and filled order blocks, dimming tested zones and removing filled zones to avoid clutter on the chart. This ensures that traders can focus on active trading opportunities without distractions from historical data.
How Does It Work?
1. Detecting Market Structure Breaks (BoS):
- The indicator continuously tracks the market for key price action signals. When the price breaks through previous highs or lows (or opens and closes, depending on your selection), the indicator marks this as a break of structure. This is a critical signal used by institutional traders and retail traders alike to determine potential future price movements.
2. Order Block Identification:
- Whenever a bullish break of structure occurs, the indicator plots a green demand box to show the area where institutional buyers might have placed significant orders. Similarly, for a bearish break of structure, it plots a red supply box representing areas where institutional sellers are active.
3. Pivot Analysis and Tracking:
- As the market moves, the indicator continuously updates first-order and second-order pivot points based on highs and lows. These points help traders identify whether the market is trending or consolidating. Traders can use these pivot points in combination with the order blocks to make informed trading decisions.
4. Box Testing and Filling:
- When the price retests an existing order block, the box dims to show it has been tested. If the price fully fills the box, it is no longer shown, which helps traders focus on the most relevant, untested order blocks.
Benefits for Traders
- Improved Decision-Making: With clear visuals and advanced logic based on institutional trading strategies, this indicator provides a deeper understanding of market structure and price action.
- Reduced Clutter: The indicator intelligently manages the display of order blocks and pivot points, ensuring that traders focus only on the most relevant information.
- Adaptability: Whether you are a swing trader or a day trader, the ICT Panther can be adjusted to fit your trading style, offering robust and flexible tools for tracking market structure and order blocks.
- Institutional Edge: By identifying institutional-level order blocks and market structure breaks, traders using this indicator can trade in line with the strategies of large market participants.
Who Should Use the ICT Panther Indicator?
This indicator is ideal for:
- Crypto, Forex, and Stock Traders who want to incorporate institutional trading concepts into their strategies.
- Technical Analysts looking for precise tools to measure the market structure and price action.
- ICT Traders who follow the Inner Circle Trader methodology and want an advanced tool to automate and enhance their analysis.
- Price Action Traders seeking a reliable indicator to track pivot points, order blocks, and market structure breaks.
The ICT Panther Indicator is a powerful, versatile tool that brings institutional trading techniques to the fingertips of retail traders. Whether you are looking to identify key market structure breaks, order blocks, or crucial pivot points, this indicator offers detailed visualizations and customizable options to help you make more informed trading decisions. With its ability to track the activities of institutional traders, the ICT Panther Indicator equips traders with the insights needed to stay ahead of the market and trade with confidence.
With the ICT Panther Indicator, traders can follow the movements of institutional money, making it easier to predict market direction and capitalize on high-probability trading opportunities.
Enjoy it and share it with your friends!

Unicorn ICT Signals [TradingFinder] Breaker Block + FVG Zones🔵 Introduction
The "ICT Unicorn Model" trading strategy in the "Inner Circle Trader" (ICT) style is one of the well-known strategies in the world of Forex and financial market trading.
The ICT methodology was developed by Michael Huddleston and is based on technical analysis and Price Action concepts.
This style focuses specifically on interpreting price movements and identifying optimal entry and exit points in the market.
In the Unicorn strategy, traders seek points where the probability of price reversal or trend continuation is high. This strategy is primarily based on recognizing and analyzing Price Action patterns and market structure.
By understanding"ICT Unicorn Model", traders can make more informed decisions about where to enter or exit trades, thereby increasing their chances of success in the market.
🟣 Understanding the Breaker Block
A Breaker Block is a specialized form of an Order Block that changes its role after a key market level is broken. Typically, an Order Block is an area on the chart where large institutional orders are likely to be placed, providing strong support or resistance.
However, when this area is breached, and the price moves in the opposite direction, it transforms into what is known as a Breaker Block. This shift indicates a reversal in market sentiment, turning the previous support into resistance or vice versa, thereby signaling a potential trend change to traders.
🟣 The Significance of the Fair Value Gap (FVG)
The Fair Value Gap (FVG) refers to an area on a price chart where the price rapidly moves through a level, leaving behind a gap. This gap represents an imbalance between supply and demand and is often seen as a potential area for price to return and fill the gap.
These zones are crucial for traders as they can indicate future price movements, providing opportunities to enter or exit trades.
🟣 Defining the ICT Unicorn Model
When an FVG overlaps with a Breaker Block, it forms a highly significant trading area known as a Unicorn. This overlap creates an ideal zone for traders to enter the market, as it combines two powerful technical signals.
The Unicorn Model is therefore considered an optimal strategy for identifying precise entry and exit points in the financial markets.
Demand ICT Unicorn Model :
Supply ICT Unicorn Model :
🔵 How to Use
🟣 Bullish ICT Unicorn
The Bullish ICT Unicorn model is applicable when the market is in an uptrend, and traders are seeking buying opportunities.
Follow these steps to identify Bullish ICT Unicorn :
Identify the Bullish Breaker Block : Locate an area where the price moved upward after breaking an Order Block. This area now acts as a Breaker Block.
Identify the Bullish FVG : Look for a Fair Value Gap near the Breaker Block.
Confirm the Unicorn : When the Bullish Breaker Block and Bullish FVG overlap, a Bullish Unicorn is confirmed. Traders can enter a buy position when the price returns to this zone.
🟣Bearish ICT Unicorn
The Bearish ICT Unicorn model is used when the market is in a downtrend, and traders are looking for selling opportunities.
To identify Bearish ICT Unicorn, follow these steps :
Identify the Bearish Breaker Block : Find an area where the price moved downward after breaking an Order Block. This area now acts as a Breaker Block.
Identify the Bearish FVG : Check if a Fair Value Gap has formed near the Breaker Block.
Confirm the Unicorn : When the Bearish Breaker Block and Bearish FVG overlap, a Bearish Unicorn is confirmed. Traders can enter a sell position when the price returns to this zone.
🔵 Setting
🟣 Global Setting
Pivot Period of Order Blocks Detector : Enter the desired pivot period to identify the Order Block.
Order Block Validity Period (Bar) : You can specify the maximum time the Order Block remains valid based on the number of candles from the origin.
Mitigation Level Breaker Block : Determining the basic level of a Breaker Block. When the price hits the basic level, the Breaker Block due to mitigation.
Mitigation Level FVG : Determining the basic level of a FVG. When the price hits the basic level, the FVG due to mitigation.
Mitigation Level Unicorn : Determining the basic level of a Unicorn Block. When the price hits the basic level, the Unicorn Block due to mitigation.
🟣 Unicorn Block Display
Show All Unicorn Block : If it is turned off, only the last Order Block will be displayed.
Demand Unicorn Block : Show or not show and specify color.
Supply Unicorn Block : Show or not show and specify color.
🟣 Breaker Block Display
Show All Breaker Block : If it is turned off, only the last Breaker Block will be displayed.
Demand Main Breaker Block : Show or not show and specify color.
Demand Sub (Propulsion & BoS Origin) Breaker Block : Show or not show and specify color.
Supply Main Breaker Block : Show or not show and specify color.
Supply Sub (Propulsion & BoS Origin) Breaker Block : Show or not show and specify color.
🟣 Fair Value Gap Display
Show Bullish FVG : Toggles the display of demand-related boxes.
Show Bearish FVG : Toggles the display of supply-related boxes.
🟣 Logic Settings
🟣 Order Block Refinement
Refine Order Blocks : Enable or disable the refinement feature. Mode selection.
🟣 FVG Filter
FVG Filter : This refines the number of identified FVG areas based on a specified algorithm to focus on higher quality signals and reduce noise.
Types of FVG filters :
Very Aggressive Filter: Adds a condition where, for an upward FVG, the last candle's highest price must exceed the middle candle's highest price, and for a downward FVG, the last candle's lowest price must be lower than the middle candle's lowest price. This minimally filters out FVGs.
Aggressive Filter: Builds on the Very Aggressive mode by ensuring the middle candle is not too small, filtering out more FVGs.
Defensive Filter: Adds criteria regarding the size and structure of the middle candle, requiring it to have a substantial body and specific polarity conditions, filtering out a significant number of FVGs.
Very Defensive Filter: Further refines filtering by ensuring the first and third candles are not small-bodied doji candles, retaining only the highest quality signals.
🟣 Alert
Alert Name : The name of the alert you receive.
Alert ICT Unicorn Model Block Mitigation :
On / Off
Message Frequency :
This string parameter defines the announcement frequency. Choices include: "All" (activates the alert every time the function is called), "Once Per Bar" (activates the alert only on the first call within the bar), and "Once Per Bar Close" (the alert is activated only by a call at the last script execution of the real-time bar upon closing). The default setting is "Once per Bar".
Show Alert Time by Time Zone :
The date, hour, and minute you receive in alert messages can be based on any time zone you choose. For example, if you want New York time, you should enter "UTC-4". This input is set to the time zone "UTC" by default.
🔵Conclusion
The Unicorn Model in ICT, utilizing the concepts of Breaker Blocks and Fair Value Gaps, provides an effective tool for identifying entry and exit points in financial markets. By offering more precise signals, this model helps traders make better decisions and minimize trading risks.
Success in applying this model requires practice and a deep understanding of market structure, but it can significantly improve trading performance.

Smart Money Concept [TradingFinder] Major OB + FVG + Liquidity🔵 Introduction
"Smart Money" refers to funds under the control of institutional investors, central banks, funds, market makers, and other financial entities. Ordinary people recognize investments made by those who have a deep understanding of market performance and possess information typically inaccessible to regular investors as "Smart Money".
Consequently, when market movements often diverge from expectations, traders identify the footprints of smart money. For example, when a classic pattern forms in the market, traders take short positions. However, the market might move upward instead. They attribute this contradiction to smart money and seek to capitalize on such inconsistencies in their trades.
The "Smart Money Concept" (SMC) is one of the primary styles of technical analysis that falls under the subset of "Price Action". Price action encompasses various subcategories, with one of the most significant being "Supply and Demand", in which SMC is categorized.
The SMC method aims to identify trading opportunities by emphasizing the impact of large traders (Smart Money) on the market, offering specific patterns, techniques, and trading strategies.
🟣 Key Terms of Smart Money Concept (SMC)
• Market Structure (Trend)
• Change of Character (ChoCh)
• Break of Structure (BoS)
• Order Blocks (Supply and Demand)
• Imbalance (IMB)
• Inefficiency (IFC)
• Fair Value Gap (FVG)
• Liquidity
• Premium and Discount
🔵 How Does the "Smart Money Concept Indicator" Work?
🟣 Market Structure
a. Accumulation
b. Market-Up
c. Distribution
d. Market-Down
a) Accumulation Phase : During the accumulation period, typically following a downtrend, smart money enters the market without significantly affecting the pricing trend.
b) Market-Up Phase : In this phase, the price of an asset moves upward from the accumulation range and begins to rise. Usually, the buying by retail investors is the main driver of this trend, and due to positive market sentiment, it continues.
c) Distribution Phase : The distribution phase, unlike the accumulation stage, occurs after an uptrend. In this phase, smart money attempts to exit the market without causing significant price fluctuations.
d) Market-Down Phase : In this stage, the price of an asset moves downward from the distribution phase, initiating a prolonged downtrend. Smart money liquidates all its positions by creating selling pressure, trapping latecomer investors.
The result of these four phases in the market becomes the market trend.
Types of Trends in Financial Markets :
a. Up-Trend
b. Down Trend
c. Range (No Trend)
a) Up-Trend : The market breaks consecutive highs.
b) Down Trend : The market breaks consecutive lows.
c) No Trend or Range : The market oscillates within a range without breaking either highs or lows.
🟣 Change of Character (ChoCh)
The "ChoCh" or "Change of Character" pattern indicates an initial change in order flow in financial markets. This structural change occurs when a major pivot in the opposite direction of the market trend fails. It signals a potential change in the market trend and can serve as a signal for short-term or long-term trend changes in a trading symbol.
🟣 Break of Structure (BoS)
The "BoS" or "Break of Structure" pattern indicates the continuation of the trend in financial markets. This structure forms when, in an uptrend, the price breaks its ceiling or, in a downtrend, the price breaks its floor.
🟣 Order Blocks (Supply and Demand)
Order blocks consist of supply and demand areas where the likelihood of price reversal is higher. There are six order blocks in this indicator, categorized based on their origin and formation reasons.
a. Demand Main Zone, "ChoCh" Origin.
b. Demand Sub Zone, "ChoCh" Origin.
c. Demand All Zone, "BoS" Origin.
d. Supply Main Zone, "ChoCh" Origin.
e. Supply Sub Zone, "ChoCh" Origin.
f. Supply All Zone, "BoS" Origin.
🟣 FVG | Inefficiency | Imbalance
These three terms are almost synonymous. They describe the presence of gaps between consecutive candle shadows. This inefficiency occurs when the market moves rapidly. Primarily, imbalances and these rapid movements stem from the entry of smart money and the imbalance between buyer and seller power. Therefore, identifying these movements is crucial for traders.
These areas are significant because prices often return to fill these gaps or even before they occur to fill price gaps.
🟣 Liquidity
Liquidity zones are areas where there is a likelihood of congestion of stop-loss orders. Liquidity is considered the driving force of the entire market, and market makers may manipulate the market using these zones. However, in many cases, this does not happen because there is insufficient liquidity in some areas.
Types of Liquidity in Financial Markets :
a. Trend Lines
b. Double Tops | Double Bottoms
c. Triple Tops | Triple Bottoms
d. Support Lines | Resistance Lines
All four types of liquidity in this indicator are automatically identified.
🟣 Premium and Discount
Premium and discount zones can assist traders in making better decisions. For instance, they may sell positions in expensive ranges and buy in cheaper ranges. The closer the price is to the major resistance, the more expensive it is, and the closer it is to the major support, the cheaper it is.
🔵 How to Use
🟣 Change of Character (ChoCh) and Break of Structure (BoS)
This indicator detects "ChoCh" and "BoS" in both Minor and Major states. You can turn on the display of these lines by referring to the last part of the settings.
🟣 Order Blocks (Supply and Demand)
Order blocks are Zones where the probability of price reversal is higher. In demand Zones you can buy opportunities and in supply Zones you can check sell opportunities.
The "Refinement" feature allows you to adjust the width of the order block according to your strategy. There are two modes, "Aggressive" and "Defensive," in the "Order Block Refine". The difference between "Aggressive" and "Defensive" lies in the width of the order block.
For risk-averse traders, the "Defensive" mode is suitable as it provides a lower loss limit and a greater reward-to-risk ratio. For risk-taking traders, the "Aggressive" mode is more appropriate. These traders prefer to enter trades at higher prices, and this mode, which has a wider order block width, is more suitable for this group of individuals.
🟣 Fair Value Gap (FVG) | Imbalance (IMB) | Inefficiency (IFC)
In order to identify the "fair value gap" on the chart, it must be analyzed candle by candle. In this process, it is important to pay attention to candles with a large size, and a candle and a candle should be examined before that.
Candles before and after this central candle should have long shadows and their bodies should not overlap with the central candle body. The distance between the shadows of the first and third candles is known as the FVG range.
These areas work in two ways :
• Supply and demand area : In this case, the price reacts to these areas and the trend is reversed.
• Liquidity zone : In this scenario, the price "fills" the zone and then reaches the order block.
Important note : In most cases, the FVG zone of very small width acts as a supply and demand zone, while the zone of significant width acts as a liquidity zone and absorbs price.
When the FVG filter is activated, the FVG regions are filtered based on the specified algorithm.
FVG filter types include the following :
1. Very Aggressive Mode : In addition to the initial condition, an additional condition is considered. For bullish FVG, the maximum price of the last candle must be greater than the maximum price of the middle candle.
Similarly, for a bearish FVG, the minimum price of the last candle must be lower than the minimum price of the middle candle. This mode removes the minimum number of FVGs.
2. Aggressive : In addition to the very aggressive condition, the size of the middle candle is also considered. The size of the center candle should not be small and therefore more FVGs are removed in this case.
3. Defensive : In addition to the conditions of the very aggressive mode, this mode also considers the size of the middle pile, which should be relatively large and make up the majority of the body.
Also, to identify bullish FVGs, the second and third candles must be positive, while for bearish FVGs, the second and third candles must be negative. This mode filters out a significant number of FVGs and keeps only those of good quality.
4. Very Defensive : In addition to the conditions of the defensive mode, in this mode the first and third candles should not be very small-bodied doji candles. This mode filters out most FVGs and only the best quality ones remain.
🟣 Liquidity
These levels are where traders intend to exit their trades. "Market makers" or smart money usually accumulate or distribute their trading positions near these levels, where many retail traders have placed their "stop loss" orders. When liquidity is collected from these losses, the price often reverses.
A "Stop hunt" is a move designed to offset liquidity generated by established stop losses. Banks often use major news events to trigger stop hunts and capture liquidity released into the market. For example, if they intend to execute heavy buy orders, they encourage others to sell through stop-hots.
Consequently, if there is liquidity in the market before reaching the order block area, the validity of that order block is higher. Conversely, if the liquidity is close to the order block, that is, the price reaches the order block before reaching the liquidity limit, the validity of that order block is lower.
🟣 Alert
With the new alert functionality in this indicator, you won't miss any important trading signals. Alerts are activated when the price hits the last order block.
1. It is possible to set alerts for each "symbol" and "time frame". The system will automatically detect both and include them in the warning message.
2. Each alert provides the exact date and time it was triggered. This helps you measure the timeliness of the signal and evaluate its relevance.
3. Alerts include target order block price ranges. The "Proximal" level represents the initial price level strike, while the "Distal" level represents the maximum price gap in the block. These details are included in the warning message.
4. You can customize the alert name through the "Alert Name" entry.
5. Create custom messages for "long" and "short" alerts to be sent with notifications.
🔵 Setting
a. Pivot Period of Order Blocks Detector :
Using this parameter, you can set the zigzag period that is formed based on the pivots.
b. Order Blocks Validity Period (Bar) :
You can set the validity period of each Order Block based on the number of candles that have passed since the origin of the Order Block.
c. Demand Main Zone, "ChoCh" Origin :
You can control the display or not display as well as the color of Demand Main Zone, "ChoCh" Origin.
d. Demand Sub Zone, "ChoCh" Origin :
You can control the display or not display as well as the color of Demand Sub Zone, "ChoCh" Origin.
e. Demand All Zone, "BoS" Origin :
You can control the display or not display as well as the color of Demand All Zone, "BoS" Origin.
f. Supply Main Zone, "ChoCh" Origin :
You can control the display or not display as well as the color of Supply Main Zone, "ChoCh" Origin.
g. Supply Sub Zone, "ChoCh" Origin :
You can control the display or not display as well as the color of Supply Sub Zone, "ChoCh" Origin.
h. Supply All Zone, "BoS" Origin :
You can control the display or not display as well as the color of Supply All Zone, "BoS" Origin.
i. Refine Demand Main : You can choose to be refined or not and also the type of refining.
j. Refine Demand Sub : You can choose to be refined or not and also the type of refining.
k. Refine Demand BoS : You can choose to be refined or not and also the type of refining.
l. Refine Supply Main : You can choose to be refined or not and also the type of refining.
m. Refine Supply Sub : You can choose to be refined or not and also the type of refining.
n. Refine Supply BoS : You can choose to be refined or not and also the type of refining.
o. Show Demand FVG : You can choose to show or not show Demand FVG.
p. Show Supply FVG : You can choose to show or not show Supply FVG
q. FVG Filter : You can choose whether FVG is filtered or not. Also specify the type of filter you want to use.
r. Show Statics High Liquidity Line : Show or not show Statics High Liquidity Line.
s. Show Statics Low Liquidity Line : Show or not show Statics Low Liquidity Line.
t. Show Dynamics High Liquidity Line : Show or not show Dynamics High Liquidity Line.
u. Show Dynamics Low Liquidity Line : Show or not show Dynamics Low Liquidity Line.
v. Statics Period Pivot :
Using this parameter, you can set the Swing period that is formed based on Static Liquidity Lines.
w. Dynamics Period Pivot :
Using this parameter, you can set the Swing period that is formed based Dynamics Liquidity Lines.
x. Statics Liquidity Line Sensitivity :
is a number between 0 and 0.4. Increasing this number decreases the sensitivity of the "Statics Liquidity Line Detection" function and increases the number of lines identified. The default value is 0.3.
y. Dynamics Liquidity Line Sensitivity :
is a number between 0.4 and 1.95. Increasing this number increases the sensitivity of the "Dynamics Liquidity Line Detection" function and decreases the number of lines identified. The default value is 1.
z. Alerts Name : You can customize the alert name using this input and set it to your desired name.
aa. Alert Demand Main Mitigation :
If you want to receive the alert about Demand Main 's mitigation after setting the alerts, leave this tick on. Otherwise, turn it off.
bb. Alert Demand Sub Mitigation :
If you want to receive the alert about Demand Sub's mitigation after setting the alerts, leave this tick on. Otherwise, turn it off.
cc. Alert Demand BoS Mitigation :
If you want to receive the alert about Demand BoS's mitigation after setting the alerts, leave this tick on. Otherwise, turn it off.
dd. Alert Supply Main Mitigation :
If you want to receive the alert about Supply Main's mitigation after setting the alerts, leave this tick on. Otherwise, turn it off.
ee. Alert Supply Sub Mitigation :
If you want to receive the alert about Supply Sub's mitigation after setting the alerts, leave this tick on. Otherwise, turn it off.
ff. Alert Supply BoS Mitigation :
If you want to receive the alert about Supply BoS's mitigation after setting the alerts, leave this tick on. Otherwise, turn it off.
gg. Message Frequency :
This parameter, represented as a string, determines the frequency of announcements. Options include: 'All' (triggers the alert every time the function is called), 'Once Per Bar' (triggers the alert only on the first call within the bar), and 'Once Per Bar Close' (activates the alert only during the final script execution of the real-time bar upon closure). The default setting is 'Once per Bar'.
hh. Show Alert time by Time Zone :
The date, hour, and minute displayed in alert messages can be configured to reflect any chosen time zone. For instance, if you prefer London time, you should input 'UTC+1'. By default, this input is configured to the 'UTC' time zone.
ii. Display More Info : The 'Display More Info' option provides details regarding the price range of the order blocks (Zone Price), along with the date, hour, and minute. If you prefer not to include this information in the alert message, you should set it to 'Off'.
You also have access to display or not to display, choose the Style and Color of all the lines below :
a. Major Bullish "BoS" Lines
b. Major Bearish "BoS" Lines
c. Minor Bullish "BoS" Lines
d. Minor Bearish "BoS" Lines
e. Major Bullish "ChoCh" Lines
f. Major Bearish "ChoCh" Lines
g. Minor Bullish "ChoCh" Lines
h. Minor Bearish "ChoCh" Lines
i. Last Major Support Line
j. Last Major Resistance Line
k. Last Minor Support Line
l. Last Minor Resistance Line

ICT Venom Trading Model [TradingFinder] SMC NY Session 2025SetupIntroduction
The ICT Venom Model is one of the most advanced strategies in the ICT framework, designed for intraday trading on major US indices such as US100, US30, and US500. This model is rooted in liquidity theory, time and price dynamics, and institutional order flow.
The Venom Model focuses on detecting Liquidity Sweeps, identifying Fair Value Gaps (FVG), and analyzing Market Structure Shifts (MSS). By combining these ICT core concepts, traders can filter false breakouts, capture sharp reversals, and align their entries with the real institutional liquidity flow during the New York Session.
Key Highlights of ICT Venom Model :
Intraday focus : Optimized for US indices (US100, US30, US500).
Time element : Critical window is 08:00–09:30 AM (Venom Box).
Liquidity sweep logic : Price grabs liquidity at 09:30 AM open.
Confirmation tools : MSS, CISD, FVG, and Order Blocks.
Dual setups : Works in both Bullish Venom and Bearish Venom conditions.
At its core, the ICT Venom Strategy is a framework that explains how institutional players manipulate liquidity pools by engineering false breakouts around the initial range of the market. Between 08:00 and 09:30 AM New York time, a range called the “Venom Box” is formed.
This range acts as a trap for retail traders, and once the 09:30 AM market open occurs, price usually sweeps either the high or the low of this box to collect stop-loss liquidity. After this liquidity grab, the market often reverses sharply, giving birth to a classic Bullish Venom Setup or Bearish Venom Setup
The Venom Model (ICT Venom Trading Strategy) is not just a pattern recognition tool but a precise institutional trading model based on time, liquidity, and market structure. By understanding the Initial Balance Range, watching for Liquidity Sweeps, and entering trades from FVG zones or Order Blocks, traders can anticipate market reversals with high accuracy. This strategy is widely respected among ICT followers because it offers both risk management discipline and clear entry/exit conditions. In short, the Venom Model transforms liquidity manipulation into actionable trading opportunities.
Bullish Setup :
Bearish Setup :
🔵 How to Use
The ICT Venom Model is applied by observing price behavior during the early hours of the New York session. The first step is to define the Initial Range, also called the Venom Box, which is formed between 08:00 and 09:30 AM EST. This range marks the high and low points where institutional traders often create traps for retail participants. Once the official market opens at 09:30 AM, price usually sweeps either the top or bottom of this box to collect liquidity.
After this liquidity grab, the market tends to reverse in alignment with the true directional bias. To confirm the setup, traders look for signals such as a Market Structure Shift (MSS), Change in State of Delivery (CISD), or the appearance of a Fair Value Gap (FVG). These elements validate the reversal and provide precise levels for trade execution.
🟣 Bullish Setup
In a Bullish Venom Setup, the market first sweeps the low of the Venom Box after 09:30 AM, triggering sell-side liquidity collection. This downward move is often sharp and deceptive, designed to stop out retail long positions and attract new sellers. Once liquidity is taken, the market typically shifts direction, forming an MSS or CISD that signals a reversal to the upside.
Traders then wait for price to retrace into a Fair Value Gap or a demand-side Order Block created during the reversal leg. This retracement offers the ideal entry point for long positions. Stop-loss placement should be just below the liquidity sweep low, while profit targets are set at the Venom Box high and, if momentum continues, at higher session or daily highs.
🟣 Bearish Setup
In a Bearish Venom Setup, the process is similar but reversed. After the Initial Range is defined, if price breaks above the Venom Box high following the 09:30 AM open, it signals a false breakout designed to collect buy-side liquidity. This move usually traps eager buyers and clears out stop-losses above the high.
After the liquidity sweep, confirmation comes through an MSS or CISD pointing to a reversal downward. At this stage, traders anticipate a retracement into a Fair Value Gap or a supply-side Order Block formed during the reversal. Short entries are taken within this zone, with stop-loss positioned just above the liquidity sweep high. The logical profit targets include the Venom Box low and, in stronger bearish momentum, deeper session or daily lows.
🔵 Settings
Refine Order Block : Enables finer adjustments to Order Block levels for more accurate price responses.
Mitigation Level OB : Allows users to set specific reaction points within an Order Block, including: Proximal: Closest level to the current price. 50% OB: Midpoint of the Order Block. Distal: Farthest level from the current price.
FVG Filter : The Judas Swing indicator includes a filter for Fair Value Gap (FVG), allowing different filtering based on FVG width: FVG Filter Type: Can be set to "Very Aggressive," "Aggressive," "Defensive," or "Very Defensive." Higher defensiveness narrows the FVG width, focusing on narrower gaps.
Mitigation Level FVG : Like the Order Block, you can set price reaction levels for FVG with options such as Proximal, 50% OB, and Distal.
CISD : The Bar Back Check option enables traders to specify the number of past candles checked for identifying the CISD Level, enhancing CISD Level accuracy on the chart.
🔵 Conclusion
The ICT Venom Model is more than just a reversal setup; it is a complete intraday trading framework that blends liquidity theory, time precision, and market structure analysis. By focusing on the Initial Range between 08:00 and 09:30 AM New York time and observing how price reacts at the 09:30 AM open, traders can identify liquidity sweeps that reveal institutional intentions.
Whether in a Bullish Venom Setup or a Bearish Venom Setup, the model allows for precise entries through Fair Value Gaps (FVGs) and Order Blocks, while maintaining clear risk management with well-defined stop-loss and target levels.
Ultimately, the ICT Venom Model provides traders with a structured way to filter false moves and align their trades with institutional order flow. Its strength lies in transforming liquidity manipulation into actionable opportunities, giving intraday traders an edge in timing, accuracy, and consistency. For those who master its logic, the Venom Model becomes not only a strategy for entry and exit, but also a deeper framework for understanding how liquidity truly drives price in the New York session.

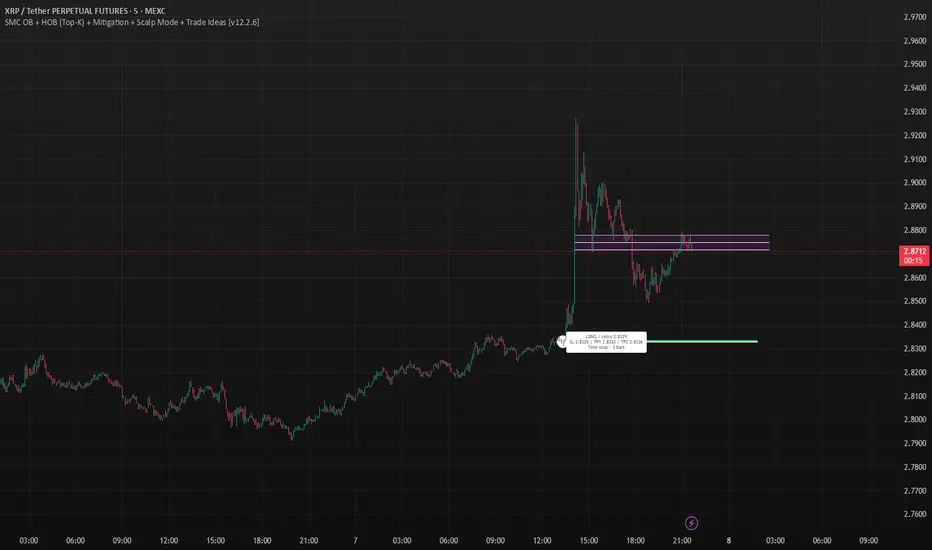
SMC OB+HOBSmart Money OB/HOB Indicator — Quick Guide
Use this as a field manual: what you’re seeing, how it’s decided, and which settings to use for different timeframes and trade styles.
What the tool plots
Bullish Order Block (OB) — teal box
The last small down candle before a bullish displacement/BOS. Height = candle body (default) or wick range (if you choose “Wick”).
Pin (small white dot) at the origin candle’s time to make anchoring obvious.
Bearish Order Block (OB) — red box
The last small up candle before a bearish displacement/BOS.
Hidden Order Block (HOB) — same box but yellow-tinted fill
A valid OB with one or more same-bias FVGs “ahead” (i.e., OB sits “behind” inefficiency). These tend to be stronger.
Mitigation state (fill transparency)
Unmitigated (least transparent): price hasn’t meaningfully traded back into the box. Highest priority.
Partial (more transparent): some penetration; still valid.
Full (most transparent): fully consumed; lower priority (optional to hide).
Top-K border — thin white outline
Only the best-scoring OBs/HOBs per direction are drawn to reduce clutter.
Auto-Fibs (optional)
OTE zone (0.62–0.79) — subtle purple band across the current swing leg.
0.618 / 0.705 / 0.786 — thin white horizontal lines. Confluence here adds score.
Trade idea lines (per Top-K block)
Entry — white line (mid/edge per your setting).
Stop — red line (box edge ± your pad).
TP1/TP2 — lime lines, R-based from entry→stop distance.
Label shows LONG/SHORT, entry, SL, TP1, TP2, time-stop (bars).
Note: Fair Value Gaps (FVGs) are tracked internally to classify HOBs and for pruning, not drawn to avoid noise.
How a block is qualified (in plain English)
BOS + Displacement:
Close breaks the recent swing high/low by at least N ticks and the bar shows impulse (body ≥ X·ATR and ≥ Y% of its total range).
(Settings: “Close beyond ≥ ticks”, “Min impulse body (x ATR)”, “Body/TR min %”)
Seed candle:
Look back ≤ N bars for the last opposite small-body candle (body ≤ Z% of its range). That candle’s body/wick becomes the OB height.
(Settings: “Last opposite candle within N bars”, “OB body ≤ % of TR”, “OB height model”)
Hidden OB:
Count same-bias FVGs “ahead”. If ≥ your threshold → tag the OB as HOB.
(Setting: “Require ≥ N same-bias FVGs ahead”)
Mitigation tracking:
As price trades into the box, we compute penetration %, updating unmitigated / partial / full state each bar.
Ranking (Top-K):
Every OB/HOB gets a score: near price, newer, hidden, near fib, and unmitigated boost. We draw only the Top-K per direction.
Inputs you’ll actually tweak
Timeframe
Compute on: Current (uses your chart TF) or Specific (MTF scan).
Process last N bars: reduce for speed, increase to see more history.
Anchoring
Extend: Right, Limited, or Origin only.
Limited draws boxes to a fixed number of bars so charts stay clean.
Show origin pins: Keep on so you always know the source candle.
Structure / BOS (signal frequency vs. quality)
Require FVG on break bar: ON = stricter, OFF = more signals.
Min impulse body (x ATR): higher = stricter.
Body/TR min %: higher = stricter.
Close beyond ≥ ticks: 0–1 for LTF; 1–3 for HTF.
Order Blocks
OB height model: Body (cleaner) or Wick (wider protection).
Last opposite candle within N bars: 3–8 (higher finds more).
OB body ≤ % of TR: 0.35–0.70 (lower = stricter).
Min OB height (ticks): 1–2 (avoid micro slivers).
Expire on first touch: If ON, removes boxes after first reaction.
Hidden OB
Require ≥ N FVGs ahead: 0–1 for LTF (more HOBs), 1–2 for HTF.
Mitigation Filter (what you show)
Toggle Unmitigated / Partial / Full visibility.
For precision trading, keep Unmitigated on; show others while scanning.
Auto-Fibs
Enable fib confluence: On adds score near 0.618/0.705/0.786.
Draw lines / OTE: Visual only; confluence also boosts ranking.
Tolerance (x ATR): how close price must be to count as “near fib”.
Ranking & Draw
Top-K per direction: how many OBs/HOBs you’ll see each side.
Prefer near / newer / hidden / unmitigated: scoring toggles.
Fib boost: how much fib confluence bumps a level.
Trade Ideas
Entry style: 50% of OB (balanced) or OB edge (faster fills).
Stop pad (ticks/ATR): give a little room beyond the box edge.
TP1/TP2 (R): risk-multiple targets (e.g., 1R, 2R).
Time stop (minutes): exit if it doesn’t go in time.
Execution / Alerts (recommended)
Keep on-close workflow: do not enable calc_on_every_tick.
When creating alerts, choose Once per bar close.
How to use it (mechanical checklist)
Scan: Focus on Top-K boxes. HOBs (yellow-tinted) and unmitigated get first look.
Context (optional): If you like, also check HTF structure or obvious liquidity pools (equal highs/lows).
Confluence: Prefer boxes near 0.618/0.705/0.786 or inside the OTE band.
Trigger: Let the bar close. If entry line is touched next, you have a go-signal with a placed stop and R-targets.
Manage: If TP1 hits, move SL to BE. For HOBs, consider a runner (trail under minor swing/FVG) — they often travel further.
Time stop: If it hasn’t moved within N minutes/bars, cut it; don’t babysit.
Preset recipes (copy these settings)
1) Hyper-Scalp (1–3m) — frequent, fast
Structure / BOS:
FVG on break = OFF | Min impulse = 0.6–0.8 | Body/TR = 0.45–0.55 | Close beyond = 0–1
Order Blocks:
Opposite lookback = 5–6 | OB body ≤ 0.55–0.60 | Min height = 1
HOB: Need FVGs = 0–1
Mitigation view: Show Unmit/Partial, optionally Full while scanning
Ranking: Top-K = 4–6, prefer near/new/hidden/unmit = ON, Fib boost = 0.6–1.0
Trade Ideas: Entry = OB edge, Stop pad = 1–2 ticks, Time stop = 5–8 min
Execution: On bar close alerts
2) Intraday (5–15m) — balanced
Structure / BOS:
FVG on break = OFF | Min impulse = 0.8–1.0 | Body/TR = 0.55–0.60 | Close beyond = 1
Order Blocks:
Opposite lookback = 4–5 | OB body ≤ 0.50–0.55 | Min height = 1–2
HOB: Need FVGs = 1
Ranking: Top-K = 3–4, Fib boost = 1.0–1.5
Trade Ideas: Entry = 50%, Stop pad = 2–3 ticks, Time stop = 10–20 min
3) Swing (1H–4H) — selective, higher quality
Structure / BOS:
FVG on break = ON | Min impulse = ≥1.0 | Body/TR = ≥0.65 | Close beyond = 1–3
Order Blocks:
Opposite lookback = 3–4 | OB body ≤ 0.45–0.50 | Min height = 2–4
HOB: Need FVGs = 1–2
Ranking: Top-K = 2–3, Fib boost = 1.5–2.0
Trade Ideas: Entry = 50%, Stop pad = a few ticks + ATR pad, Time stop = few bars
4) HTF (Daily+) — very selective
Keep swing settings, increase Min impulse and Close beyond a bit, reduce Top-K to 1–2.
Priority rules (what to trade first)
HOB over OB
Unmitigated over partial/full
With fib confluence over without
Near price and recent over far/old
Favor levels that follow a sweep (equal highs/lows taken, then return to your box)
If two boxes tie, take the one with the cleaner origin candle and simpler path to TP (fewer nearby obstacles).
Troubleshooting & tips
“I’m not seeing many signals.”
Loosen Structure/BOS (lower ATR and Body/TR), increase Opposite lookback, allow Partial/Full in view, raise Top-K.
“Too many lines/boxes.”
Lower Top-K, use Limited extension (Anchoring), hide Partial/Full, and keep fib lines if you rely on confluence.
“Stuff looks offset.”
Keep origin pins on. Use xloc.bar_time (already in code) and avoid custom time compressions that desync objects.
Execution discipline:
Use on-close alerts. Respect time stops. Size by fixed risk per trade, not fixed leverage.
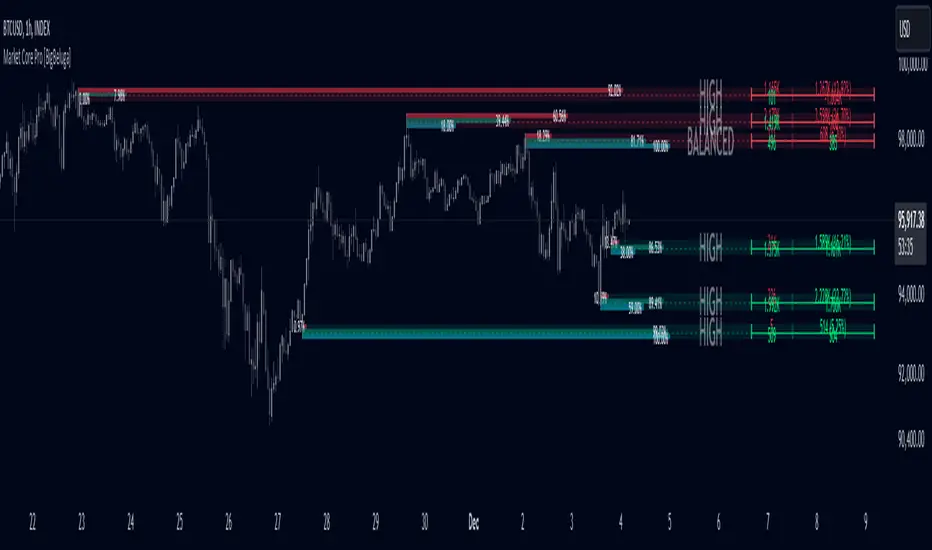
Market Core [BigBeluga]MARKET CORE Toolkit
The BigBeluga Market Core Toolkit is a comprehensive suite of advanced trading indicators designed to provide traders with a holistic view of market dynamics, structure, and potential opportunities.
In an ever-evolving market, relying on a single indicator can leave traders vulnerable to gaps in their analysis. The BigBeluga Market Core Toolkit addresses this challenge by integrating a range of complementary indicators that work synergistically to reveal the full picture. From detecting key support and resistance levels to identifying market structure shifts, volume imbalances, inefficiencies or analysis of money flow, this toolkit covers every aspect of market behavior.
⬤ Order Blocks
BigBeluga Order Blocks revolutionize the way traders visualize potential areas of significant market activity. Unlike traditional order block indicators that often result in cluttered, noisy charts, these Order Blocks are designed for clarity and effectiveness. They simulate and predict where large areas of market orders may rest by analyzing volume and volatility, providing excellent support or resistance areas.
The blocks offer cleaner chart presentation with reasonable distribution, volume ratio visualization within each block, and categorization into Strong, High and Balanced blocks.
Additionally, a third line has been introduced to rank order blocks by volume using a modified percent rank method for more precise ranking.
This ranking system uses percentile ranks, a concept commonly used in standardized tests. In the context of order blocks, the percentile rank of a particular order block's volume is interpreted as the percentage of the order blocks strength. This method provides a more nuanced and statistically robust way of comparing and prioritizing order blocks.
Key features:
Cleaner chart presentation with reasonable distribution of blocks
Volume ratio visualization within each block (bullish vs bearish)
Categorization into High and Balanced blocks for easy identification of significant levels
Relative volume percentage and volume delta display
Advanced ranking system using modified percent rank method for volume comparison
These Order Blocks help traders:
Forecast excellent support or resistance areas
Gain insight into the balance of the market at specific levels
Identify significant market levels at a glance
Visualize market imbalances through volume delta
Prioritize order blocks based on their relative volume importance
Make more informed decisions about potential entry and exit points
⬤ Beluga Profile
The Beluga Profile is a revolutionary market analysis tool that transforms complex market data into a clear, intuitive visual narrative. At its core, it combines a Dual-Profile Analysis, merging Delta Volume Profile with Money Flow Profile to give traders a comprehensive view of market dynamics.
The percentage scale on the left side aren't just numbers; they represent the Levels Strength Percentage, a crucial ranking system that immediately draws your attention to the most significant price zones. Complementing this, a heat map overlay brings these strength levels to life, offering an instant, color-coded representation of where the market's most influential areas lie.
To the right, a detailed breakdown of volume and money flow for each level provides the hard data behind the visual cues. This granular information allows you to dive deep into the market's structure, understanding not just where the significant levels are, but why they matter.
Below the main chart, the Delta Volume Bar serves as a foundation, showing the average delta of the volume profile. This bar is more than just a measure of volume – it's a window into the underlying forces driving price movement. Just above this bar, a macro trend indicator in the form of an arrow offers a quick, clear signal of the overall market direction based on these delta volume calculations.
But the Beluga Profile doesn't just show you what's happening – it helps you understand the 'why' and 'how'. The Adaptive Points of Interest feature allows you to customize your analysis, focusing on the areas that matter most to your trading strategy. You can select from various options including Money Flow, Delta+, Delta-, Volume+, and Level % (Highest), tailoring the display to your specific analytical needs. This flexibility ensures you can focus on the most relevant data for your trading style. Real-time Active Price Tracking ensures you're always in sync with the latest market movements.
All of these elements work in concert, creating a symphony of market information. They empower you to:
Spot key price levels with uncanny precision
Foresee potential market turns before they happen
Grasp the quality and strength of price moves
Adjust your strategy on the fly as market conditions shift
Develop a holistic understanding of market structure and participant behavior
Make informed decisions backed by a clear view of the overall market trend
In essence, the Beluga Profile isn't just a tool – it's your market storyteller, translating the complex language of price, volume, and money flow into a narrative that you can understand and act upon with confidence.
⬤ Smart Money Concepts (SMC)
The Smart Money Concepts component of the toolkit focuses on automatically detecting key market structures crucial in technical analysis. It identifies and visualizes Break of Structure (BOS) and Change of Character (CHOCH) patterns, helping traders spot potential trend reversals and significant market movements. This includes BOS identification when price breaks previous support or resistance and CHOCH detection for potential trend reversals, with automatic detection of both bullish and bearish patterns.
The latest enhancement to this feature adds a new layer of analysis through Delta Volume Calculation. When a BOS or CHOCH is detected, the toolkit calculates the delta volume within the range from the high or low point to the break point. This analysis considers all the candles in this range and determines whether the volume is predominantly bullish, bearish, or neutral.
Bullish Volume: If the delta volume is bullish, a green diamond is plotted at the high or low point, indicating potential upward momentum.
Bearish Volume: If the delta volume is bearish, a red diamond is plotted, suggesting downward pressure.
Neutral Volume: When the volume is neutral, a yellow diamond is displayed, indicating a balance in buying and selling forces.
This visual representation of volume dynamics provides an additional layer of insight, helping traders assess the strength and direction of price movements following a structure break. You can see an example of this on the attached image, where the diamonds clearly indicate the type of volume driving the breakout.
The toolkit also incorporates Fair Value Gap (FVG) Detection. Fair Value Gaps represent inefficiencies in the market, where there is an imbalance between buy and sell orders. These gaps often act as magnets for price, potentially leading to future reversals or continuations when filled. The toolkit identifies and highlights these gaps, allowing traders to recognize areas where the market may seek to rebalance.
Additionally, Double Top and Bottom Pattern Detection has been integrated, identifying potential reversal points at these classic price formations. Double tops signal potential bearish reversals after a price peak, while double bottoms suggest potential bullish reversals after a price dip. These patterns can be crucial indicators for traders looking to capitalize on upcoming trend changes.
Smart Money Concepts help traders:
Identify potential trend reversals early with a clearer view of market structure.
Recognize significant changes in market structure and volume participation.
Differentiate between temporary pullbacks and genuine trend changes using volume insights (color coded diamonds).
Shows Fair Value gaps which helps to identify price momentum and inefficiencies in the market.
This enhancement ensures that traders can not only see structural changes but also understand the volume behind those moves, leading to more informed and confident trading decisions.
⬤ Support and Resistance Levels
This powerful tool is designed to identify key price levels in the market, providing traders with a clear visual representation of potential support and resistance areas. It goes beyond simple level identification by incorporating a sophisticated ranking system and adjustable sensitivity.
The grading system of levels is a unique feature that evaluates the significance of high and low points in the price action. It takes into consideration how many times the price has touched or interacted with specific levels. This means that levels which have been tested multiple times are given higher importance in the ranking. For example, a price level that has acted as support or resistance three times will be ranked higher than a level that has only been touched once.
By leveraging this grading system, traders can focus on the most significant levels that have repeatedly influenced price action, potentially improving the accuracy of their trading decisions and risk management strategies.
This Support and Resistance Levels indicator helps traders:
Identify and prioritize potential reversal points based on their historical significance and frequency of price interaction
Set more accurate entry and exit points aligned with key market levels, focusing on those with higher ranking
Understand the hierarchical structure of market support and resistance, distinguishing between major and minor levels
Plan stop-loss and take-profit levels with greater precision, using the ranking to gauge the strength of each level
Adapt their analysis to varying market strengths and volatilities, with the ability to filter out less significant levels
Recognize recurring price patterns and potential breakout levels based on the ranked historical price interactions
⬤ How to Use the Toolkit
Each of these indicators, while powerful on its own, works synergistically with the others to provide a more complete picture of the market.
The strength of this toolkit lies in its ability to analyze the market from multiple perspectives
Combining these advanced trading indicators into a cohesive toolkit empowers traders with a comprehensive, multi-dimensional view of the market that no single indicator could provide on its own. The market's complexity demands an approach that goes beyond relying on just one aspect, such as price action, volume, or order flow. Integrating these diverse indicators creates a robust analytical framework that captures the market from multiple angles, leading to more accurate insights and better-informed decision-making.
Analyze Order Blocks to identify potential support/resistance and volume imbalances
Use Beluga Profile for comprehensive market structure and trend analysis
Monitor SMC indicators for potential trend reversals and breakouts
Utilize Support and Resistance Levels for precise entry/exit points and risk management
Combine insights from all tools for a multi-dimensional view of market conditions
⬤ Customization
Each component of the toolkit offers various customization options to suit different trading styles and preferences. These inputs allow traders to adjust settings to better fit their analysis needs and strategies:
Order Blocks
- Order Blocks : Set the amount of Order Blocks on the chart.
- Color Selection : Choose the color for highlighting the order blocks on your chart.
Market Structure
- Sensitivity : Adjust the sensitivity for detecting market structure breaks. Higher sensitivity will detect more granular breaks, while lower sensitivity focuses on more significant movements.
- Data : Enable or disable the display of market structure data.
- Zigzag Option : Toggle Zigzag displays from highs and lows.
S/R (Support and Resistance)
- Sensitivity : Control how sensitive the tool is in detecting support and resistance levels. Lower sensitivity will highlight fewer but stronger levels, while higher sensitivity may reveal more levels.
- Width % : Adjust the width of the support and resistance zones to visually emphasize their importance.
- Color Selection : Choose colors for both support and resistance levels for better clarity.
FVG (Fair Value Gap)
- Max : Set the maximum number of fair value gaps to display. Higher values will show more gaps, while lower values will focus on the most prominent ones.
- Color Selection : Customize the color for the fair value gap areas.
Volume Profile
- Length : Define the look-back period for the volume profile analysis. A longer length considers more historical data, while a shorter length focuses on recent data.
- Levs : Choose the number of volume levels to display, allowing for more or fewer volume bars within the profile.
- BG : Enable or disable background shading for the volume profile.
- HeatMap : Activate or deactivate the heat map overlay for volume intensity visualization.
- POC (Point of Control) : Toggle the Point of Control display and choose between different metrics, such as volume+, money flow, Delta+ and Delta-, Level % (Highesr), to base the POC on.
- Color Selection : Customize the color for the Point of Control line.
These customization options provide traders with the flexibility to tailor the toolkit to their specific trading strategies, enhancing their ability to identify key market signals with precision.
Each component of the toolkit offers various customization options to suit different trading styles and preferences.
The BigBeluga Market Core Toolkit synthesizes complex market data into clear, actionable formats, providing traders with professional-level insights. It's a comprehensive market analysis system that can give traders a significant edge in understanding market behavior and identifying high-probability trade setups. While highly effective, it's recommended to use this toolkit in conjunction with fundamental analysis and sound risk management practices for optimal trading results.
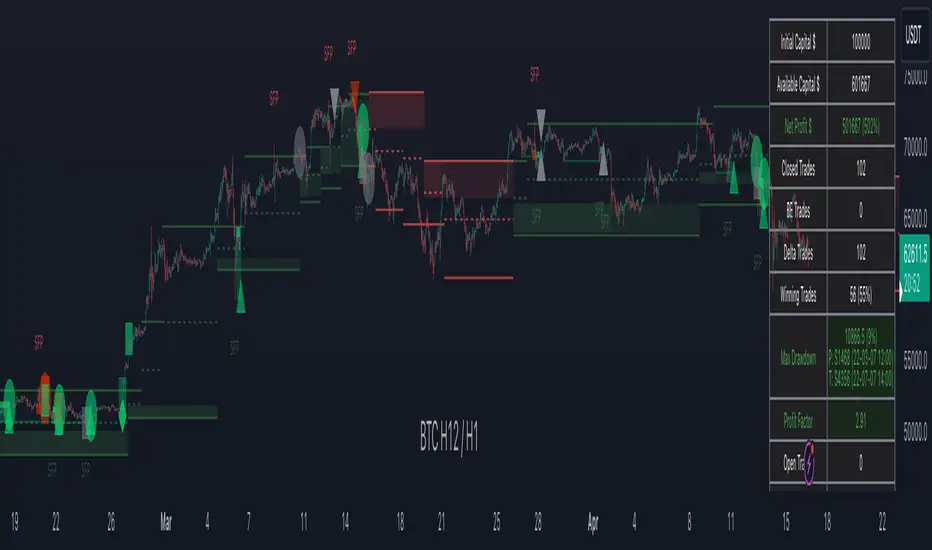
RunRox - Backtesting System (ASMC)Introducing RunRox - Backtesting System (ASMC), a specially designed backtesting system built on the robust structure of our Advanced SMC indicator. This innovative tool evaluates various Smart Money Concept (SMC) trading setups and serves as an automatic optimizer, displaying which entry and exit points have historically shown the best results. With cutting-edge technology, RunRox - Backtesting System (ASMC) provides you with effective strategies, maximizing your trading potential and taking your trading to the next level
🟠 HOW OUR BACKTESTING SYSTEM WORKS
Our backtesting system for the Advanced SMC (ASMC) indicator is meticulously designed to provide traders with a thorough analysis of their Smart Money Concept (SMC) strategies. Here’s an overview of how it works:
🔸 Advanced SMC Structure
Our ASMC indicator is built upon an enhanced SMC structure that integrates the Institutional Distribution Model (IDM), precise retracements, and five types of order blocks (CHoCH OB, IDM OB, Local OB, BOS OB, Extreme OB). These components allow for a detailed understanding of market dynamics and the identification of key trading opportunities.
🔸 Data Integration and Analysis
1. Historical Data Testing:
Our system tests various entry and exit points using historical market data.
The ASMC indicator is used to simulate trades based on predefined SMC setups, evaluating their effectiveness over a specified time period.
Traders can select different parameters such as entry points, stop-loss, and take-profit levels to see how these setups would have performed historically.
2. Entry and Exit Events:
The backtester can simulate trades based on 12 different entry events, 14 target events, and 14 stop-loss events, providing a comprehensive testing framework.
It allows for testing with multiple combinations of entry and exit strategies, ensuring a robust evaluation of trading setups.
3. Order Block Sensitivity:
The system uses the sensitivity settings from the ASMC indicator to determine the most relevant order blocks and fair value gaps (FVGs) for entry and exit points.
It distinguishes between different types of order blocks, helping traders identify strong institutional zones versus local zones.
🔸 Optimization Capabilities
1. Auto-Optimizer:
The backtester includes an auto-optimizer feature that evaluates various setups to find those with the best historical performance.
It automatically adjusts parameters to identify the most effective strategies for both trend-following and counter-trend trading.
2. Stop Loss and Take Profit Optimization:
It optimizes stop-loss and take-profit levels by testing different settings and identifying those that provided the best historical results.
This helps traders refine their risk management and maximize potential returns.
3. Trailing Stop Optimization:
The system also optimizes trailing stops, ensuring that traders can maximize their profits by adjusting their stops dynamically as the market moves.
🔸 Comprehensive Reporting
1. Performance Metrics:
The backtesting system provides detailed reports, including key performance metrics such as Net Profit, Win Rate, Profit Factor, and Max Drawdown.
These metrics help traders understand the historical performance of their strategies and make data-driven decisions.
2. Flexible Settings:
Traders can adjust initial balance, commission rates, and risk per trade settings to simulate real-world trading conditions.
The system supports testing with different leverage settings, allowing for realistic assessments even with tight stop-loss levels.
🔸 Conclusion
The RunRox Backtesting System (ASMC) is a powerful tool for traders seeking to validate and optimize their SMC strategies. By leveraging historical data and sophisticated optimization algorithms, it provides insights into the most effective setups, enhancing trading performance and decision-making.
🟠 HERE ARE THE AVAILABLE FEATURES
Historical backtesting for any setup – Select any entry point, exit point, and various stop-loss options to see the results of your setup on historical data.
Auto-optimizer for finding the best setups – The indicator displays settings that have shown the best results historically, providing valuable insights.
Auto-optimizer for counter-trend setups – Discover entry and exit points for counter-trend trading based on historical performance.
Auto-optimizer for stop-loss – The indicator shows stop-loss points that have been most effective historically.
Auto-optimizer for take-profit – The indicator identifies take-profit points that have performed well in historical trading data.
Auto-optimizer for trailing stop – The indicator presents trailing stop settings that have shown the best historical results.
And much more within our indicator, all of which we will cover in this post. Next, we will showcase the possible entry points, targets, and stop-loss options available for testing your strategies
🟠 ENTRY SETTINGS
12 Event Triggers for Trade Entry
Extr. ChoCh OB
Extr. ChoCh FVG
ChoCh
ChoCh OB
ChoCh FVG
IDM OB
IDM FVG
BoS FVG
BoS OB
BoS
Extr. BoS FVG
Extr. BoS OB
3 Trade Direction Options
Long Only: Enter long positions only
Short Only: Enter short positions only
Long and Short: Enter both long and short positions based on trend
3 Levels for Order Block/FVG Entries
Beginning: Enter the trade at the first touch of the Order Block/FVG
Middle: Enter the trade when the middle of the Order Block/FVG is reached
End: Enter the trade upon full filling of the Order Block/FVG
*Three levels work only for Order Blocks and FVG. For trade entries based on BOS or CHoCH, these settings do not apply as these parameters are not available for these types of entries
You can choose any combination of trade entries imaginable.
🟠 TARGET SETTINGS
14 Target Events, Including Fixed % and Fixed RR (Risk/Reward):
Fixed - % change in price
Fixed RR - Risk Reward per trade
Extr. ChoCh OB
Extr. ChoCh FVG
ChoCh
ChoCh OB
ChoCh FVG
IDM OB
IDM FVG
BoS FVG
BoS OB
BoS
Extr. BoS FVG
Extr. BoS OB
3 Levels of Order Block/FVG for Target
Beginning: Close the trade at the first touch of your target.
Middle: Close the trade at the midpoint of your chosen target.
End: Close the trade when your target is fully filled.
Customizable Parameters
Easily set your Fixed % and Fixed RR targets with a user-friendly input field. This field works only for the Fixed and Fixed RR entry parameters. When selecting a different entry point, this field is ignored
Choose any combination of target events to suit your trading strategy.
🟠 STOPLOSS SETTINGS
14 Possible StopLoss Events Including Entry Orderblock/FVG
Fixed - Fix the loss on the trade when the price moves by N%
Entry Block
Extr. ChoCh OB
Extr. ChoCh FVG
ChoCh
ChoCh OB
ChoCh FVG
IDM OB
IDM FVG
BoS FVG
BoS OB
BoS
Extr. BoS FVG
Extr. BoS OB
3 Levels for Order Blocks/FVG Exits
Beginning: Exit the trade at the first touch of the order block/FVG.
Middle: Exit the trade at the middle of the order block/FVG.
End: Exit the trade at the full completion of the order block/FVG.
Dedicated Field for Setting Fixed % Value
Set a fixed % value in a dedicated field for the Fixed parameter. This field works only for the Fixed parameter. When selecting other exit parameters, this field is ignored.
🟠 ADDITIONAL SETTINGS
Trailing Stop, %
Set a Trailing Stop as a percentage of your trade to potentially increase profit based on historical data.
Move SL to Breakeven, bars
Move your StopLoss to breakeven after exiting the entry zone for a specified number of bars. This can enhance your potential WinRate based on historical performance.
Skip trade if RR less than
This feature allows you to skip trades where the potential Risk-to-Reward ratio is less than the number set in this field.
🟠 EXAMPLE OF MANUAL SETUP
For example, let me show you how it works on the chart. You select entry parameters, stop loss parameters, and take profit parameters for your trades, and the strategy automatically tests this setup on historical data, allowing you to see the results of this strategy.
In the screenshot above, the parameters were as follows:
Trade Entry: CHoCH OB (Beginning)
Stop Loss: Entry Block
Take Profit: Break of BOS
The indicator will automatically test all possible trades on the chart and display the results for this setup.
🟠 AUTO OPTIMIZATION SETTINGS
In the screenshot above, you can see the optimization table displaying various entry points, exits, and stop-loss settings, along with their historical performance results and other parameters. This feature allows you to identify trading setups that have shown the best historical outcomes.
This functionality will enhance your trading approach, providing you with valuable insights based on historical data. You’ll be aware of the Smart Money Concept settings that have historically worked best for any specific chart and timeframe.
Our indicator includes various optimization options designed to help you find the most effective settings based on historical data. There are 5 optimization modes, each offering unique benefits for every trader
Trend Entry - Optimization of the best settings for trend-following trades. The strategy will enter trades only in the direction of the trend. If the trend is upward, it will look for long entry points and vice versa.
Counter Trend Entry - Finding setups against the trend. If the trend is upward, the script will search for short entry points. This is the opposite of trend entry optimization.
Stop Loss - Identifying stop-loss points that showed the best historical performance for the specific setup you have configured. This helps in finding effective exit points to minimize losses.
Take Profit - Determining targets for the configured setup based on historical performance, helping to identify potentially profitable take profit levels.
Trailing Stop - Finding optimal percentages for the trailing stop function based on historical data, which can potentially increase the profit of your trades.
Ability to set parameters for auto-optimization within a specified range. For example, if you choose FixRR TP from 1 to 10, the indicator will automatically test all possible Risk Reward Take Profit variations from 1 to 10 and display the results for each parameter individually.
Ability to set initial deposit parameters, position commissions, and risk per trade as a fixed percentage or fixed amount. Additionally, you can set the maximum leverage for a trade.
There are times when the stop loss is very close to the entry point, and adhering to the risk per trade values set in the settings may not allow for such a loss in any situation. That’s why we added the ability to set the maximum possible leverage, allowing you to test your trading strategy even with very tight stop losses.
Duplicated Smart Money Structure settings from our Advanced SMC indicator that you can adjust to match your trading style flexibly. All these settings will be taken into account during the optimization process or when manually calculating settings.
Additionally, you can test your strategy based on higher timeframe order blocks. For example, you can test a strategy on a 1-minute chart while displaying order blocks from a 15-minute timeframe. The auto-optimizer will consider all these parameters, including higher timeframe order blocks, and will enter trades based on these order blocks.
Highly flexible dashboard and results optimization settings allow you to display the tables you need and sort results by six different criteria: Profit Factor, Profit, Winrate, Max Drawdown, Wins, and Trades. This enables you to find the exact setup you desire, based on these comprehensive data points.
🟠 ALERT CUSTOMIZATION
With this indicator, you can set up buy and sell alerts based on the test results, allowing you to create a comprehensive trading strategy. This feature enables you to receive real-time signals, making it a powerful tool for implementing your trading strategies.
🟠 STRATEGY PROPERTIES
For backtesting, we used realistic initial data for entering trades, such as:
Starting balance: $1000
Commission: 0.01%
Risk per trade: 1%
To ensure realistic data, we used the above settings. We offer two methods for calculating your order size, and in our case, we used a 1% risk per trade. Here’s what it means:
Risk per trade: This is the maximum loss from your deposit if the trade goes against you. The trade volume can change depending on your stop-loss distance from the entry point. Here’s the formula we use to calculate the possible volume for a single trade:
1. quantity = percentage_risk * balance / loss_per_1_contract (incl. fee)
Then, we calculate the maximum allowed volume based on the specified maximum leverage:
2. max_quantity = maxLeverage * balance / entry_price
3. If quantity < max_quantity, meaning the leverage is less than the maximum allowed, we keep quantity. If quantity > max_quantity, we use max_quantity (the maximum allowed volume according to the set leverage).
This way, depending on the stop-loss distance, the position size can vary and be up to 100% of your deposit, but the loss in each trade will not exceed the set percentage, which in our case is 1% for this backtest. This is a standard risk calculation method based on your stop-loss distance.
🔸 Statistical Significance of Trade Data
In our strategy, you may notice there weren’t enough trades to form statistically significant data. This is inherent to the Smart Money Concept (SMC) strategy, where the focus is not on the number of trades but rather on the risk-to-reward ratio per trade. In SMC strategies, it’s crucial to avoid taking numerous uncertain setups and instead perform a comprehensive analysis of the market situation.
Therefore, our strategy results show fewer than 100 trades. It’s important to understand that this small sample size isn’t statistically significant and shouldn’t be relied upon for strategy analysis. Backtesting with a small number of trades should not be used to draw conclusions about the effectiveness of a strategy.
🔸 Versatile Use Cases
The methods of using this indicator are numerous, ranging from identifying potentially the best-performing order blocks on the chart to creating a comprehensive trading strategy based on the data provided by our indicator. We believe that every trader will find a valuable application for this tool, enhancing their entry and exit points in trades.
Disclaimer
Past performance is not indicative of future results. The results shown by this indicator do not guarantee similar outcomes in the future. Use this tool as part of a comprehensive trading strategy, considering all market conditions and risks.
How to access
For access to this indicator, please read the author’s instructions below this post
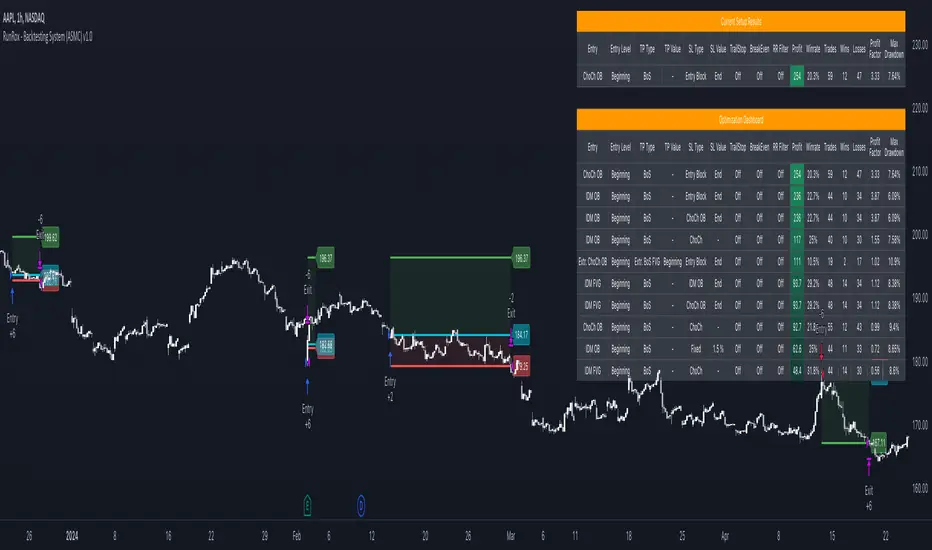
True SMCThe True SMC Indicator is specifically designed for structure mapping and the identification of high-probability Order Blocks. Excelling in distinctly recognising four types of Order Blocks, it provides traders with a direct and efficient method to dissect market movements and identify strategic entry points with precision
🔶 Understanding Structure Mapping
This indicator introduces a unique approach to analysing market structure, focusing on liquidity, which is termed 'Inducement'. Inducement is crucial for identifying key structural markers in the market, such as Higher Highs (HH), Higher Lows (HL), Lower Lows (LL), and Lower Highs (LH).
Inducement acts like a trap set near a supply or demand zone. It entices impatient buyers or sellers into the market before the actual zone is reached, thereby creating liquidity. For an inducement to be considered valid, it must represent a valid pullback.
A valid scenario occurs when the price sweeps or closes beyond the high or low of the previous candle; in this case, the candle's color, whether bullish or bearish, is not relevant, and both scenarios are considered valid. Inside bars are ignored as they do not meet this criterion. The indicator assists in this process by automatically highlighting valid pullbacks with a distinctive gray round label.
This feature is not just a visual aid but also a crucial tool in effortlessly understanding market movements, providing a clear visual representation of ongoing market trends.
🔶 Understanding How Order Block is working
Our indicator incorporates four distinct types of Order Blocks, each designed for specific roles in market analysis. Among these, the **OB-IDM** and **OB-EXT** are regarded as high-probability Order Blocks, and our primary focus is on these two for market entry.
IDM Order Block (OB-IDM): IDM Order block (OB-IDM) is basically the first Order Block that shows up after the IDM level is passed. Think of it as the closest OB you find below the current IDM.
Extreme Order Block (OB-EXT): OB-EXT is the first and lowest Order Block that you'll find between a Major Low and a Major High.
Single Candle Order Block (SCOB): Single candle mitigation is very Powerful way to add multiple entries in you're winning trades.
Smart Money Trap (SMT): The SMT consists of all the Order Blocks that lie between the Extreme and OB-IDM. It acts as a cautionary signal, indicating potential traps for Smart Money Concept traders. It is essential to recognize that the SMT does not provide additional confirmation for trading. Instead, it highlights areas where traders should exercise extra caution. Trading decisions should be based on clear confirmations, such as inducements or liquidity sweeps, rather than solely on the SMT.
🔶 How to Use the True SMC Indicator:
The True SMC Indicator is designed to enhance your trading strategy by identifying key order blocks and market signals. Below is a guide on how to utilize the various elements of the True SMC Indicator:
OB IDM (Order Block Inducement):
Usage : This is a decisional order block crucial for identifying trade entries. It is particularly effective for pinpointing potential reversal zones.
Alerts: Setting up alerts on OB IDM is recommended to be notified when the price reaches this critical area, thus facilitating prompt and informed trading decisions.
OB-EXT (Extreme Order Block):
Usage : OB-EXT serves as an extreme and high-probability order block for trade entries, ideal for identifying strategic entry points at potential reversal points.
Alerts: Activating alerts on OB-EXT will keep you informed about price approaches, aiding in the preparation of your trade setups.
SCOB (Single Candle Order Block):
Usage : SCOB is ideal for scaling into a position. It should be employed for adding to positions when the market reacts to OB IDM or OB-EXT, indicating a potential reversal.
SMT (Smart Money Trap):
Usage Caution: The SMT should be approached with caution as it represents a potential trap. It is advised to avoid trading directly at SMT zones. Instead, use these zones to gauge market sentiment and make informed decisions.
This structured approach to using the True SMC Indicator will help you in making more precise and strategic trading decisions, enhancing your overall market analysis.
🔶 Example of usage:
Market Structure Diagram
This diagram illustrates the key structural markers in the market such as Higher Highs (HH), Higher Lows (HL), Lower Lows (LL), and Lower Highs (LH). It provides a visual guide to understanding the underlying market structure.
Example from a Real Chart: This chart is a prime example of how our indicator is used to dissect and highlight market structure in a live trading environment. It vividly demonstrates the 'Inducement' concept in action, pinpointing key structural points like HH, HL, LL, and LH in real-time market trends.
Valid Pullback
Illustration of a Valid Pullback: This image showcases a typical scenario where the price sweeps beyond the previous candle's high or low, marking a valid pullback. Notice the distinctive gray round label indicating the point of inducement.
IDM Order Block (OB-IDM)
This diagram illustrates the IDM Order Block (OB-IDM), highlighting its position as the first OB following the IDM level. It represents the nearest OB below the current IDM level.
IDM Order Block in Action This real chart example showcases the OB-IDM in a live market scenario, demonstrating how it appears and functions in practical trading.
Extreme Order Block (OB-EXT)
The diagram depicts the OB-EXT, which is identified as the first and lowest Order Block between a Major Low and a Major High.
OB-EXT in Real Market: This chart example highlights the OB-EXT, showing its position and significance in market analysis between major market points.
Single Candle Order Block (SCOB)
The accompanying chart demonstrates the SCOB in a live trading environment, illustrating its effectiveness in trade optimization.
Smart Money Trap (SMT)
This real chart provides insight into how the SMT is used in actual trading, marking areas for increased caution and illustrating its role in a comprehensive trading strategy.
🔶 Additional Features
Easy-to-Follow Trend Display : The script employs a Color Coded candle system, simplifying trend recognition.
Any Alert function call = It can be configured for a range of trading events, allowing you to stay informed about key market movements. In the settings, you can choose to enable or disable alerts for events such as BOS Sweep, CHock, CHock Sweep, IDM, IDM Sweep, OB IDM, OB EXT, and PDH/PDL.
Automatic resolving of ChoCh-IDM and IDM-BoS conflicts = The indicator is equipped to automatically resolve conflicts that arise between ChoCh-IDM and IDM-BoS. It intelligently identifies situations where there might be an IDM instead of a ChoCh, or a BoS instead of an IDM, ensuring accurate readings and analysis.
Anywhere Structure Mapping : The tool simplifies market analysis by enabling you to draw structures from any chosen moment. Simply adjust the slider to your desired point and instantly trade based on the internal structure revealed. This feature offers an intuitive and efficient way to understand and navigate market dynamics.
🔶 Conclusion
The True SMC Indicator distinguishes itself from other market analysis tools through its specialised focus on structure mapping and high-probability Order Blocks. Unlike generic indicators, it expertly identifies and categorizes four distinct types of Order Blocks, including IDM and Extreme Order Blocks, which are crucial for high-accuracy trade entries. Its unique approach in analysing market structure centers on 'Inducement,' a key concept for pinpointing vital market structural markers. This feature, combined with its ability to alert traders to both promising entry points and potential Smart Money Traps, equips users with a comprehensive tool for a nuanced understanding of market dynamics and strategic trade execution. Such targeted capabilities make the True SMC Indicator an invaluable asset for traders seeking precision and efficiency in their market analysis.
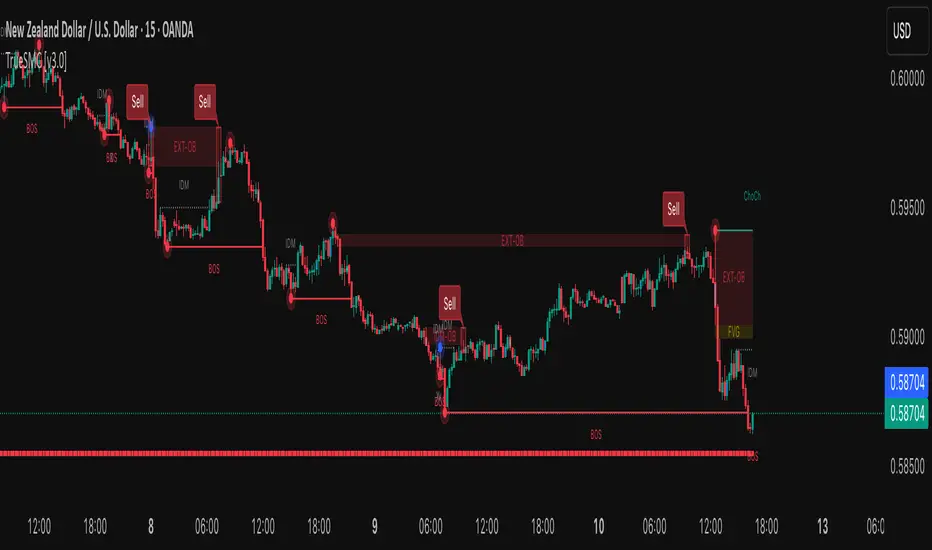
Advanced Institucional Trading IndicatorThe Advanced Institutional Trading Indicator is a comprehensive technical analysis tool that combines four institutional trading concepts to identify where large market participants hunt liquidity, establish positions, and create supply/demand imbalances. The indicator integrates pivot-based reversal signals, liquidity sweep detection, volumetric order blocks, and equal highs/lows identification into a unified framework for analyzing institutional footprints in the market.
What It Detects
Pivot-Based Reversal Signals: Swing highs/lows marking potential trend reversals
Liquidity Sweeps: False breakouts indicating institutional stop-hunting
Volumetric Order Blocks: Supply/demand zones with buying vs selling pressure ratios
Equal Highs/Lows (EQH/EQL): Liquidity pools where stops cluster
In Practice
Traders can watch for equal highs/lows near order blocks, wait for sweeps of these levels as confirmation of liquidity capture, then look for reversal signals to time entries with the expectation that institutions have now positioned themselves and the true directional move can begin.
Logic used
Pivots: Standard functions with configurable periods, signals when swing type alternates
Sweeps: Detects brief violations of swing levels with cooldown filter
Order Blocks: Three-candle volume split into buying/selling pressure, filtered by ATR
Equal Levels: Compares consecutive pivots within ATR-based threshold
Visual representation
Reversal Signals: Green "Buy-point"/red "Sell-point" labels.
Sweeps: Dashed lines with "Sweep" text and swing markers.
Order Blocks: Colored boxes with volumetric bars and percentages.
Equal Levels: Golden lines with $ symbols.
Customization options
Pivot Length, Cooldown Period, Swing Length, Zone Count (1/3/5/10), ATR Multiplier, Threshold, customizable colors and styles.
Recommendations for use: Lower timeframes use smaller parameters (5-15 pivot, 20-35 swing). Higher timeframes use larger (20-50 pivot, 50-100 swing). Adjust for volatility.
Originality and value
While this indicator utilizes established concepts from institutional trading methodology (particularly Smart Money Concepts and ICT principles), its value proposition includes:
- Integration: Combines four complementary analysis tools into a single cohesive framework rather than requiring multiple separate indicators
- Volumetric Enhancement: Adds quantitative volume analysis to order blocks, showing not just where institutions positioned but how much buying vs selling pressure existed
- Automated Zone Management: Intelligently combines overlapping order blocks to reduce visual noise while preserving essential information
- Intelligent Filtering: Uses ATR-based thresholds for equal highs/lows and maximum order block size, adapting to market volatility
- Coordinated Signaling: All components reference similar swing detection logic, creating alignment between different institutional footprint indicators
Disclaimer
This indicator is a technical analysis tool and does not constitute financial advice.
/////Descripcion en español/////
El Advanced Institutional Trading Indicator combina cuatro conceptos institucionales—reversiones por pivotes, barridos de liquidez, bloques volumétricos y niveles iguales—para identificar dónde grandes participantes cazan liquidez y establecen posiciones.
Qué detecta
1. Reversiones por Pivotes: Máximos/mínimos marcando cambios de tendencia
2. Barridos de Liquidez: Falsas roturas indicando caza de stops institucional
3. Bloques Volumétricos: Zonas oferta/demanda con ratios presión compradora/vendedora
4. Niveles Iguales (EQH/EQL): Pools de liquidez donde se agrupan stops
Cómo usarlo
Observar niveles iguales cerca de bloques, esperar barridos como confirmación de captura de liquidez, entrar con señales de reversión cuando instituciones se han posicionado.
Lógica utilizada
- Pivotes: Funciones estándar configurables, señaliza cuando alternan
- Barridos: Detecta violaciones breves con filtro de enfriamiento
- Bloques: Volumen de tres velas dividido en presión compradora/vendedora, filtrado por ATR
- Niveles Iguales: Compara pivotes consecutivos dentro de umbral ATR
Representación visual
Señales: Etiquetas "Buy/Sell-point" verdes/rojas. Barridos: Líneas punteadas con "Sweep" y marcadores swing. Bloques: Cajas con barras volumétricas y porcentajes. Niveles: Líneas doradas con símbolo $.
Configuraciones clave
Pivot Length, Cooldown Period, Swing Length, Zone Count (1/3/5/10), ATR Multiplier, Threshold, colores y estilos personalizables.
Consejos: Marcos menores usan parámetros pequeños (5-15 pivot, 20-35 swing). Marcos mayores usan grandes (20-50 pivot, 50-100 swing). Ajustar según volatilidad.
Originalidad
Integra cuatro herramientas en un marco. Añade análisis volumétrico a bloques. Combina automáticamente zonas superpuestas. Usa filtrado adaptativo basado en ATR. Alinea componentes con lógica unificada basada en Smart Money/ICT.
Descargo
Herramienta de análisis técnico, no asesoramiento financiero.

Scalping MasterMarket Structure Analysis:
Swing Structure: Detects higher highs (HH), lower highs (LH), higher lows (HL), aur lower lows (LL) ko identify karta hai using pivot points (based on ta.highest aur ta.lowest).
Internal Structure: Chhote timeframes ke liye internal swing points aur break of structure (BOS)/change of character (CHoCH) ko track karta hai.
BOS/CHoCH Detection: Bullish aur bearish structure breaks (BOS) aur trend reversals (CHoCH) ko label karta hai.
Order Blocks (OB):
Internal Order Blocks: Chhote timeframe ke order blocks ko plot karta hai, jo liquidity zones ko represent karte hain.
Swing Order Blocks: Bade timeframe ke order blocks ko show karta hai.
Filtering: ATR ya Cumulative Mean Range ke basis par volatile order blocks ko filter karta hai.
Fair Value Gaps (FVG):
Price gaps (bullish aur bearish) ko detect aur plot karta hai.
Auto-threshold aur timeframe customization ke saath FVGs ko filter karta hai.
FVGs ko extend karne ka option deta hai (visual representation ke liye).
Equal Highs/Lows (EQH/EQL):
Equal highs aur lows ko identify karta hai, jo support/resistance zones ke liye useful hote hain.
Bars confirmation aur sensitivity threshold ke saath customizable hai.
Previous Highs/Lows (MTF):
Daily, weekly, aur monthly high/low levels ko plot karta hai.
Line style (solid, dashed, dotted) aur colors customizable hain.
Premium/Discount Zones:
Market ke premium, equilibrium, aur discount zones ko highlight karta hai, jo price action ke liye key areas hote hain.
Visual Customization:
Color Themes: Colored ya monochrome themes ke options.
Candle Coloring: Trend ke hisaab se candles ko color karta hai.
Labels aur Lines: Swing points, strong/weak highs/lows, aur structure breaks ke liye labels aur lines plot karta hai.
Modes:
Historical Mode: Past data ke saath complete structure dikhata hai.
Present Mode: Sirf recent structure aur signals dikhata hai, clutter reduce karne ke liye.
Alerts:
Bullish/Bearish BOS, CHoCH, order block breaks, aur EQH/EQL ke liye alerts set karne ka option.
Swing Points aur Trailing:
Strong/weak high aur low points ko track karta hai.
Trailing maximum/minimum ko extend karta hai for real-time analysis.
Kya Kya Mila Kar Bana Hai?
Yeh indicator Smart Money Concepts ke core principles par based hai aur in elements ko combine karta hai:
Pivot Point Analysis:
ta.highest aur ta.lowest functions se swing highs/lows detect karta hai.
Internal aur swing structure ke liye alag-alag lengths (e.g., length aur 5 for internal swings).
Price Action Concepts:
Break of Structure (BOS): Jab price pivot high/low ko break karta hai.
Change of Character (CHoCH): Jab trend reverse hota hai.
Confluence filtering ke saath accuracy improve karta hai.
Order Blocks:
Liquidity zones ko identify karne ke liye high/low ranges aur ATR/cumulative mean range ka use.
Bullish aur bearish order blocks ke liye customizable colors.
Fair Value Gaps:
Gaps in price action ko detect karne ke liye OHLC data ka analysis.
Timeframe aur auto-threshold ke saath flexibility.
MTF (Multi-Timeframe) Analysis:
Daily, weekly, monthly high/low levels ke liye ta.valuewhen aur time-based calculations.
Zones Detection:
Premium, equilibrium, aur discount zones ke liye price range calculations.
Visual Tools:
Lines, labels, aur boxes ke saath market structure ko visually represent karta hai (line.new, label.new, box.new).
Extendable lines aur boxes for better visibility.
User Inputs:
Customizable settings jaise timeframe, colors, lengths, aur filters, jo user ko flexibility dete hain.
Technical Components
PineScript Functions: ta.crossover, ta.crossunder, ta.highest, ta.lowest, ta.atr, ta.cum for calculations.
Arrays: Order blocks ke coordinates store karne ke liye (array.new_float, array.new_int, array.new_box).
Drawing Tools: Lines, labels, aur boxes ke saath dynamic plotting.
Conditional Logic: BOS, CHoCH, aur other signals ke liye complex conditions.
Timeframe Support: Multi-timeframe analysis ke liye input.timeframe.
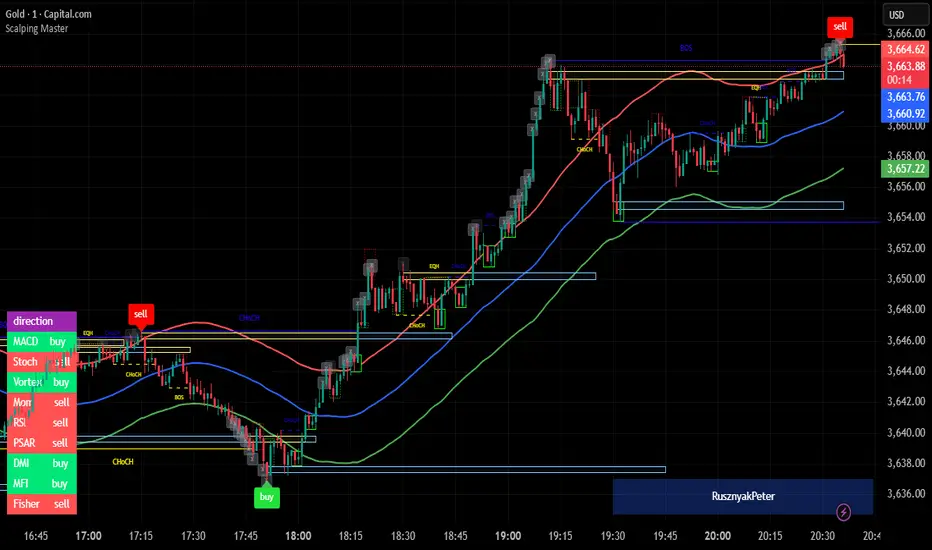
ICT Unicorn Breaker + FVG Alert📌 How to Use the ICT Breaker Block Indicator
The ICT Breaker Block Indicator helps you spot potential trade opportunities by setting up alerts. Here’s how to get started:
1️⃣ Draw Your Breaker Block
First, find a Bullish or Bearish Breaker Block on your chart.
Bullish Breaker Block: This forms when a bearish order block doesn't hold, and price breaks through to the upside. This indicates a shift from a bearish to a bullish market, with the previous bearish order block now acting as support.
Bearish Breaker Block: This forms when a bullish order block fails to hold, and price breaks through to the downside. This indicates a shift from a bullish to a bearish market, with the previous bullish order block now acting as resistance.
Use the drawing tool to mark the Breaker Block on your chart.
2️⃣ Set Your Entry & Stop Levels
Entry: For a bullish trade, enter at the top of the Breaker Block; for a bearish trade, enter at the bottom.
Stop Loss: Place this on the opposite side of the Breaker Block.
3️⃣ Choose Your Trade Direction
Bullish setup: Choose Buy for a bullish Breaker Block (upward break).
Bearish setup: Choose Sell for a bearish Breaker Block (downward break).
4️⃣ Create Two Alerts
You’ll need to set up the following two alerts in order:
✅ Unicorn Alert (Once Per Bar Close): Set this alert first for your selected Breaker Block (Bullish or Bearish). It triggers when price closes above the entry level (for a bullish setup) or below the entry level (for a bearish setup), and checks for bullish or bearish unmitigated Fair Value Gaps (FVGs) that overlap within the Breaker Block.
✅ Terminus Alert (Triggered Once): Once the Unicorn alert has been triggered, change the alert to a Terminus Alert. This alert is activated once the TP (terminus) is hit before the limit order fills from the Unicorn alert signal.
5️⃣ Automate with Webhook (Optional)
Want to automate your trades? Simply enter your Trader Post Webhook URL in the alert settings to send signals directly to your trading bot! 🤖

OrderBlocksLibrary "OrderBlocks"
This is a library I created that creates order blocks. It's originated from my indicator "Order blocks" (). It will return a Zone object that can be used to draw an order block. If you want to see how that is done you can check out my indicar that uses the same logic.
Create(settings)
Creates an order block if one is found according to the settings parameter.
Parameters:
settings (Settings) : set all values in this parameter to define the settings for the order block creation.
Returns: a Zone object if an order block is found, na otherwise
Zone
Fields:
Time (series int)
TimeClose (series int)
High (series float)
Low (series float)
ReactionLimit (series float)
TouchedZone (Zone type from mickes/Touched/14)
Type (series int)
Zones
Fields:
Index (series int)
Maximum (series int)
Zones (array)
Remove (Zone)
Settings
Fields:
TakeOut (series bool)
ReactionFactor (series float)
Type (series string)
ConsecutiveRisingOrFalling (series bool)
FairValueGap (series bool)
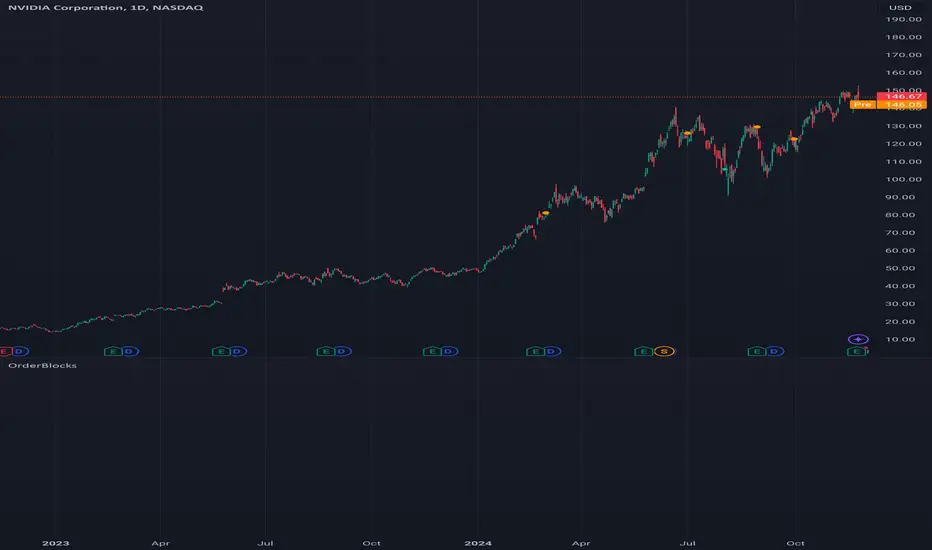
LIT_Globas_sys - Liquidity Inducement Theorem (SMC, IDM)LIT_GLOBAL_SYS Trading Tool Documentation, is a comprehensive market analysis tool that includes all components needed for trading according to Liquidity Inducement Theorem (LIT). LIT differs from classical trading methods and is considered a highly effective and profitable strategy.
What can LIT_GLOBAL_SYS do?
--- Market Structure
The main feature of Liquidity Inducement Theorem is building the correct structure, specifically construction taking into account inducement (IDM). Thus, a new HH or LL can only form when the price has taken the first correct pullback - inducement (IDM), and after this, we understand the location of BoS (break of structure) and CHoCH (change of character).
LIT_GLOBAL_SYS automatically and perfectly displays the correct structure following all LIT rules. Looking at the indicator, a trader always understands which range the price is currently in and where it's trending at the moment. The indicator also shows dynamic (live) levels, providing a clear understanding of the market structure in real-time.
The indicator settings allow customization of each structural element according to trader preferences. For example, you can change the style, color, and shape of structural objects.
--- Correct Pullbacks and Inside Bars
In Liquidity Inducement Theorem, correct pullbacks are fundamental. The structure, order blocks, liquidity levels, order flow, and single candle order blocks (CSOB) are all built based on pullbacks.
What is a pullback?
- When the next candle updates the low of the previous candle, we can finish drawing an upward pullback
- We can start drawing a downward correct pullback when the next candle updates the low of the previous candle
- The downward movement will continue until the opposite occurs - updating the high of the previous candle
There are complexities in determining pullbacks - these are inside bars. In Liquidity Inducement Theorem, inside bars are completely ignored!
For example, in an upward movement, at some point, candles may stop updating the high and low of the previous candle and remain within the boundaries of the previous candle. Theoretically, there could be any number of such candles from 1 to infinity. In such cases, it's important to wait for the price to exit the mother candle (the candle after which other candles remained within its high and low range).
LIT_GLOBAL_SYS easily handles this and displays both pullbacks and inside bars correctly.
--- Order Blocks and Fair Value Gaps (FVG)
In Liquidity Inducement Theorem, order blocks are defined differently from classical order blocks:
1. The order block must take liquidity from the previous candle
2. The order block must have Fair Value Gaps (FVG) before it
3. Inside bars are completely ignored for both Order Blocks and FVG
4. If an OB fulfills the first condition (taking liquidity from the previous candle) but doesn't have FVG before it, this block is moved forward along the candles until there is an imbalance before it
There are two most important order blocks in LIT strategy:
1. Inducement order block (idm ob) - the first order block after Inducement
2. Extreme order block (Ext ob) - the first order block before CHoCH
LIT_GLOBAL_SYS perfectly displays correct order blocks and Fair Value Gaps following all rules. It offers full customization options:
- Specify the number of displayed OBs
- Disable all order blocks except idm ob and Ext ob
- Change block frame color and style
- Disable or modify text display in blocks
--- Single Candle Order Block (Scob)
Rules for building Scob:
1. The candle takes liquidity from the previous candle and closes within the body of the previous candle
2. The candle following the Scob candle must close its body below the previous candle
3. Scob forms in continuation of the trend movement
4. Scob completely ignores inside bars
LIT_GLOBAL_SYS accurately displays Scob as triangles and fully ignores inside bars both left and right. The menu allows complete customization of display and quantity of displayed Scobs.
--- Liquidity Lines, Order Flow, and Three-Minute Rule
Auxiliary functions include:
- Liquidity Lines -
Each pullback is marked with a line, showing where unclosed liquidity exists. Completed lines can be hidden to help predict price movement and enter trades correctly.
- Order Flow -
The indicator implements order flow by drawing a line when a pullback is broken (closed by body) in the opposite direction until the second touch. If price moves away without a second touch, the line remains, showing unclosed OF and potential price return zones.
- Three-Minute Rule -
Some LIT traders use the three-minute rule: price manipulations in the last and first three minutes of each 15-minute candle are additional entry factors, especially in the last quarter of an hourly candle. LIT_GLOBAL_SYS displays this rule only on the one-minute timeframe with symbols below for M15 and H1.
--- Trading Sessions, PDH/PDL, and EMA
The system includes:
- Trading sessions (Tokyo, Frankfurt, London, New York) with customizable time settings
- Previous Day High and Previous Day Low (pdh/pdl) levels
- Exponential Moving Average (EMA) with adjustable length
- Equilibrium display between current BoS and CHoCH levels
--- Alert System
LIT_GLOBAL_SYS includes all necessary alerts for Liquidity Inducement Theorem:
1. SCOB
2. EMA
3. BoS, ChoCh, Sweep
4. IDM
5. IDM OB and Ext OB
Users can simply check the desired alerts in the menu and activate them to receive notifications when price reaches specified zones.
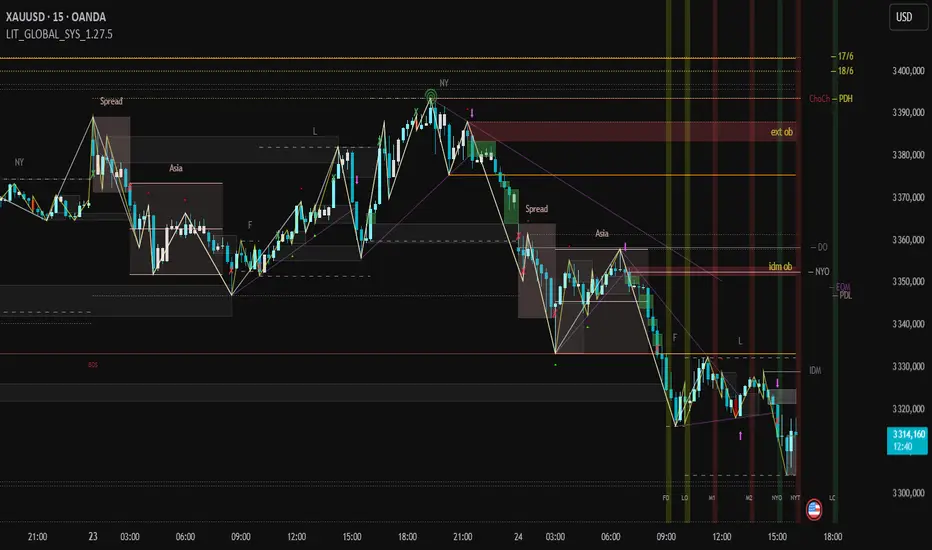
ICT Indicator with Paper TradingThe strategy implemented in the provided Pine Script is based on **ICT (Inner Circle Trader)** concepts, particularly focusing on **order blocks** to identify key levels for potential reversals or continuations in the market. Below is a detailed description of the strategy:
### 1. **Order Block Concept**
- **Order blocks** are price levels where large institutional orders accumulate, often leading to a reversal or continuation of price movement.
- In this strategy, **order blocks** are identified when:
- The high of the current bar crosses above the high of the previous bar (for bullish order blocks).
- The low of the current bar crosses below the low of the previous bar (for bearish order blocks).
### 2. **Buy and Sell Signal Generation**
The core of the strategy revolves around identifying the **breakout** of order blocks, which is interpreted as a signal to either enter or exit trades:
- **Buy Signal**:
- Generated when the closing price crosses **above** the last identified bullish order block (i.e., the highest point during the last upward crossover of highs).
- This signals a potential upward trend, and the strategy enters a long position.
- **Sell Signal**:
- Generated when the closing price crosses **below** the last identified bearish order block (i.e., the lowest point during the last downward crossover of lows).
- This signals a potential downward trend, and the strategy exits any open long positions.
### 3. **Strategy Execution**
The strategy is executed using the `strategy.entry()` and `strategy.close()` functions:
- **Enter Long Positions**: When a buy signal is generated, the strategy opens a long position (buying).
- **Exit Positions**: When a sell signal is generated, the strategy closes the long position.
### 4. **Visual Indicators on the Chart**
To make the strategy easier to follow visually, buy and sell signals are marked directly on the chart:
- **Buy signals** are indicated with a green upward-facing triangle above the bar where the signal occurred.
- **Sell signals** are indicated with a red downward-facing triangle below the bar where the signal occurred.
### 5. **Key Elements of the Strategy**
- **Trend Continuation and Reversals**: This strategy is attempting to capture trends based on the breakout of important price levels (order blocks). When the price breaks above or below a significant order block, it is expected that the market will continue in that direction.
- **Order Block Strength**: Order blocks are considered strong areas where price action could reverse or accelerate, based on how institutional investors place large orders.
### 6. **Paper Trading**
This script uses **paper trading** to simulate trades without actual money being involved. This allows users to backtest the strategy, seeing how it would have performed in historical market conditions.
### 7. **Basic Strategy Flow**
1. **Order Block Identification**: The script constantly monitors price movements to detect bullish and bearish order blocks.
2. **Buy Signal**: If the closing price crosses above the last order block high, the strategy interprets it as a sign of bullish momentum and enters a long position.
3. **Sell Signal**: If the closing price crosses below the last order block low, it signals a bearish momentum, and the strategy closes the long position.
4. **Visual Representation**: Buy and sell signals are displayed on the chart for easy identification.
### **Advantages of the Strategy:**
- **Simple and Clear Rules**: The strategy is based on clearly defined rules for identifying order blocks and trade signals.
- **Effective for Trend Following**: By focusing on breakouts of order blocks, this strategy attempts to capture strong trends in the market.
- **Visual Aids**: The plot of buy/sell signals helps traders to quickly see where trades would have been placed.
### **Limitations:**
- **No Shorting**: This strategy only enters long positions (buying). It does not account for shorting opportunities.
- **No Risk Management**: There are no built-in stop losses, trailing stops, or profit targets, which could expose the strategy to large losses during adverse market conditions.
- **Whipsaws in Range Markets**: The strategy could produce false signals in sideways or choppy markets, where breakouts are short-lived and prices quickly reverse.
### **Overall Strategy Objective:**
The goal of the strategy is to enter into long positions when the price breaks above a significant order block, and exit when it breaks below. The strategy is designed for trend-following, with the assumption that price will continue in the direction of the breakout.
Let me know if you'd like to enhance or modify this strategy further!

MA OrderBlocks [AlgoAlpha]🟨 HMA OrderBlocks by AlgoAlpha is a powerful tool designed to help traders visualize key pivot zones and order blocks based on the Hull Moving Average (HMA). By dynamically identifying bullish and bearish pivot points, this script provides insights into potential price reversals and trend continuations. With customizable settings, it allows traders to tweak the behavior of the indicator to match their strategies. Plus, it comes packed with built-in alerts for trend changes, making it easier to spot potential trade opportunities.
Key Features :
📊 Trend Detection : Utilizes Hull Moving Average to detect the current trend.
🟢🔴 Bullish & Bearish Zones : Automatically plots bullish and bearish order blocks, using customizable colors for clear visual cues.
🎯 Pivot Points : Detects and marks pivot highs and lows, helping traders spot key price reversals.
🚨 Alerts : Built-in alert system for when the price approaches key bullish or bearish zones, or when the trend changes.
🔨 Customizable MA: Choose from various moving averages (SMA, HMA, EMA, etc.) to suit your strategy.
How to Use :
⭐ Add the Indicator : Add the indicators to favourites by pressing the star icon. Once added, configure settings like the Hull MA period and pivot detection period.
📈 Analyze the Chart : Watch for the plotted order blocks and pivot points to identify possible price action strategies.
🔔 Enable Alerts : Set up alerts to be notified of potential trend reversals or when the price nears a bullish/bearish block.
How It Works :
The script starts by calculating the Hull Moving Average (HMA) based on the user-defined length, which is used to determine the market trend direction. It compares the current HMA value with the previous one to confirm whether the price is trending upwards or downwards. Once a trend change is detected, it plots bullish or bearish order blocks based on recent pivot highs and lows. These zones are extended in real-time as long as they remain invalidated. Zones are invalidated are invalidated when price completely closes through them. If the price gets close to a zone in the opposing direction, a warning system alerts the user that the block may not hold. Additionally, customizable alerts trigger whenever the price trend shifts or the price gets near important bullish/bearish blocks. The script’s logic ensures that order blocks are cleared if price violates them, keeping the chart clean and updated.
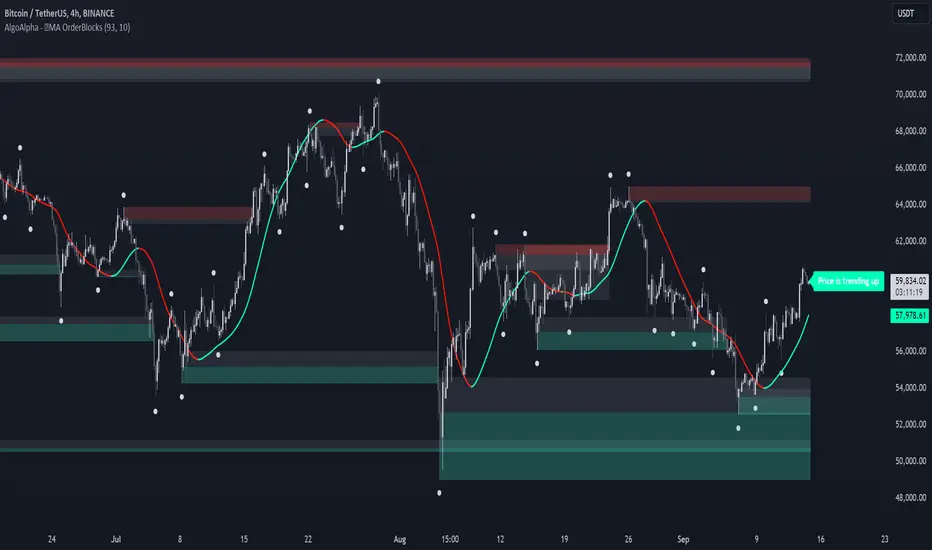
Propulsion Blocks | Flux Charts💎 GENERAL OVERVIEW
Introducing our new Propulsion Blocks indicator! This new indicator can find & render ICT's propulsion blocks in the current ticker. It's highly customizable with detection, invalidation and style settings. For more information, please visit the "HOW DOES IT WORK ?" section.
Features of the new Propulsion Blocks indicator :
Render Bullish & Bearish Propulsion Blocks
Customizable Algorithm
Enable / Disable Historic Zones
Visual Customizability
📌 HOW DOES IT WORK ?
Order blocks occur when there is a high amount of market orders exist on a price range. It is possible to find order blocks using specific formations on the chart. One of which this indicator uses requires a large engulfing candlestick right after another one of the opposite direction. Then if the price comes back to retest the area that two candlesticks create, then it's an order block pattern.
Propulsion blocks are a specific type of order block used in the trading methodology. They build on the concept of order blocks and aim to identify potential areas for strong price movements. They are detected when a candlestick wicks to any existing order block, retesting it. Then a strong momentum in the direction of the order block is needed for the propulsion block to get created. Check this example :
You can use them as entry / exit points, or for confirmations for your trades. For example, a successful retest attempt to a bullish propulsion block might hint a strong bullish momentum. This indicator works best when used together with other ICT concepts.
🚩UNIQUENESS
Propulsion blocks can help traders identify key levels in a chart, and can be used mainly for confirmation. This indicator can identify and show them automatically in your chart, and provides customization settings for order & propulsion block detection and invalidation. Another capability of the indicator is that it combines overlapping order & propulsion blocks so you will have a clean look at the chart without any overlapping zones.
⚙️SETTINGS
1. General Configuration
Show Historic Zones -> This setting will hide invalidated propulsion blocks if enabled.
Max Distance To Last Bar -> This setting defines the maximum range that the indicator will find propulsion blocks to the past. Higher options will make older zones visible.
Zone Invalidation -> Select between Wick & Close price for Order Block & Propulsion Block Invalidation.
Swing Length -> Swing length is used when finding order block formations. Smaller values will result in finding smaller order blocks.

TradesAI - Elite (Premium)This is an all-inclusive, premium indicator that focuses mainly on price action analysis, a form of looking at raw price data and market structure to analyze and capture areas of interest where price could react.
This indicator is a perfect trading companion that saves you a lot of time in trading price action. Some of the popular methods that use price action analysis are "Smart Money Concepts (SMC)", "Inner Circle Trader (ICT)", and "Institutional Trading".
🔶 POWERFUL TOOLS
The indicator combines three main tools as a trading suite:
Trendlines
Market Structure Breakouts (MSB)
Order Blocks (OBs) and Reversal Order Blocks (ROBs)
These 3 main tools are interconnected together. Below we go over each, and then explain how and why they are brought in together. Please also note that the indicator's settings have tooltips next to most of them, with more detailed information.
🔶 TRENDLINES
This indicator automatically draws the most relevant Trendlines from pivot high/pivot low (based on the defined settings) as origins, while keeping track of candle closes across these Trendlines to adjust or invalidate accordingly.
The indicator will draw all possible Trendlines up to the maximum allowed by TradingView's PineScript. It uses a bullish pivot high candle to draw downtrends, and a bearish pivot low candle to draw uptrends. The algorithm will draw the most suitable active Trendlines from those origin points.
The indicator takes the origin point as the first point of the Trendline, then starts looking for the immediate next same-type candle (bullish to bullish or bearish to bearish), to draw the Trendline between the origin candle and this newer candle.
An uptrend is a ray connecting two bearish candles, as long as the second candle has a Low higher than the low of the origin (first) candle. A downtrend is a ray connecting two bullish candles, as long as the second candle has a high lower than the high of the origin (first) candle.
Upon drawing, the indicator then starts monitoring and adjusting this Trendline, by keeping the origin always the same but changing the second point. The goal is to keep reducing the slope of the Trendline till it is at 0 degrees (horizontal line). That then makes the Trendline "final". Note that you have the option to keep all Trendlines or just show the final, in the settings.
So, the algorithm has three states for the Trendlines:
Initial: not tested, meaning price hasn't yet broken through it and closed a candle beyond it, to cause a re-adjustment of this Trendline.
Broken: a candle hard closed (opened and closed) across it but still, the direction of the trend is maintained with a new Trendline from the same origin – could be replaced (or kept on the chart as a "backside", which is what we call a broken Trendline to be tested from the opposite side) with a new Trendline from the same origin, to the newest candle that caused the break to happen, as then it becomes the new second point of that Trendline.
Final: a candle hard closed (opened and closed) across it and can't draw a new Trendline from the same origin maintaining the direction of the trend (so an uptrend becomes a downtrend or a downtrend becomes an uptrend at this point, which is not allowed). This marks the end of the Trendline adjustment for that origin.
To summarize the Trendlines algorithm, imagine starting from a candle and drawing the Trendline, then keep re-adjusting it to make its slope less and less, till it becomes a horizontal line. That's the final state.
Here is a step-by-step scenario to demonstrate the algorithm:
Notice how first an Uptrend (green ray) is drawn between point A origin pivot (picked by our smart algorithm) and point B, both marked by green arrows:
Uptrend then turned into backside (where it flips from diagonal support to resistance where liquidity potentially resides):
Then a new uptrend is drawn from the same point A origin pivot to a new point B matching the filters in settings.
Finally, it turns also into a backside and is considered final because no more uptrends could be drawn from the same point A origin point.
Unlike traditional Trendline tools, this indicator takes into account numerous rules for each candlestick to determine valid support and resistance levels, which act as liquidity zones.
Unlike conventional Trendline tools, this indicator allows the user to define the pivot point left and right length to capture the proper ones as origins, then automatically recognizes and extends lines from them as liquidity zones where a reaction is expected. Moreover, the indicator monitors those Trendlines in real-time to switch them from buying to selling zones, and vice-versa, as the price structure changes.
Features
Log vs. Linear scale switch to show different Trendlines accordingly. When updating the Trendlines, or deciding whether Touches/Hard Closes are met, it makes a difference.
Ability to show all forms of Trendlines, final Trendlines or just backside Trendlines.
Why is it used?
For experienced traders, it offers the advantage of time efficiency, while new traders can bypass the steep learning curve of drawing Trendlines manually, which could practically be drawn between any two candlesticks on the chart (many variations).
🔶 MARKET STRUCTURE BREAKOUT (MSB)
The Market Structure Breakouts (MSB) tool is a trading tool that detects specific patterns on trading charts and provides ‘take profit’ regions based on the extended direction of the identified pattern. A breakout is a potential trading opportunity that presents itself when an asset's price moves away from a zone of accumulation (i.e. above a resistance level or below a support level) on increasing volume. The most famous form of market structure breakout is double/triple tops/bottoms, or what is referred to as W or M breakouts.
See this example below of how our MSB smart algorithm picked the local bottom of INDEX:BTCUSD
Here is a step-by-step scenario to demonstrate the algorithm:
First, the algorithm picks the pivot points according to our Machine Learning (ML) model, which uses Average True Range (ATR) and Moving Averages of various types to decide. It will then signal a Market Structure Breakout (MSB):
You may either short (sell) this MSB towards the targets (dotted green lines) and/or buy (long) at the targets (dotted green lines). Usually, these targets provide scalp moves, according to our model, but they may also act as strong reversal points on the chart.
Unlike standard indicators, the MSB tool identifies patterns that may not appear in every time frame due to specific conditions that need to be met, including Average True Range (ATR) and Moving Averages at the time of creation. Once these patterns are identified, the tool gives ‘take profit’ regions in the direction of the trading pattern and even allows for trading in the opposite direction (contrarian/counter-trend scalps) once those regions are reached. A confirmed breakout has the potential to drive the price to these specific targets, calculated based on our Machine Learning (ML) model. The Targets are the measured moves placed from the breakout point.
Features
Log vs. Linear scale switch to show different MSBs accordingly based on the ratios.
Detects trading patterns with specific conditions.
Ability to specify how sensitive the pivot points are for capturing market structure breakouts.
Provides take profit regions in the extended direction of the pattern.
Allows for versatile trading styles by permitting trades in the opposite direction (contrarian or counter-trend) once the take profit region is reached.
Highlights 2 levels of interest for potential trade initiation (or as targets of the MSB move).
🔶 ORDER BLOCK (OB) and REVERSAL ORDER BLOCK (ROB)
Before diving deeper into OBs and ROBs, you may consider the following chart for a general understanding of price ladders, and how they break. This is a bearish price ladder leaving Lower Lows and Lower Highs after an initial Low and High (L->H->LL->LH). Bullish ladders are the opposite (H->L->HH->HL).
In this bearish ladder case, notice the numbers representing the highs made (being lower). While this is a clean structure, markets don't always create such clean ladders, but you may switch to a higher timeframe to see it in a clearer form (usually, you will be able to spot it there).
In SMC or ICT concepts, the "Break Of Structure (BOS)" is pretty much creating a new lower low (LL) for the bearish ladder (and the creation of a higher high (HH) for the bullish ladder). By doing so, markets are grabbing liquidity below these levels and could either continue the ladder or stop/flip it. This gives you the context of how the ladder prints.
Price usually ends the ladder with a "Change of Character (CHoCH)", which represents a BOS (to grab liquidity) followed by an aggressive move in the opposite direction, which could lead the market to close the gaps and balance out. It is considered a good practice to then target liquidity in the opposite direction when a CHoCH happens, meaning for a bearish ladder you may target the pivots marked by 3, 2 and 1 at the top (start of the ladder).
Now we move to Order Blocks (OBs) and Reversal Order Blocks (ROBs). Think of them as sniper zones or micro ladders inside the bigger ladder/structure.
Order Blocks are usually used as zones of support and resistance on a trading chart where liquidity is present, or what some traders call "potential institutional interest zones". Order Blocks can be observed at the beginning of these strong moves of BOS or the CHoCH, leaving behind a zone (one or more candles) to be revisited later to balance the market. Therefore, these are interesting levels to place Limit/Market orders (sell the peaks or buy the valleys) instead of doing so at the swing highs or swing lows of the ladder (where BOS or CHoCH happened). The idea here is that the price could go deep into the ladder's step (peak or valley), and by doing so, it usually goes to these zones.
A bullish Order Block (Valley-OB) is the last bearish candle of a downtrend before a sequence of bullish candles (thus forming a "Valley"). A bearish Order Block (Peak-OB) is the last bullish candle of an uptrend before a sequence of bearish candles (thus forming a "Peak"). Our indicator captures the full range zones of the OB meaning not only the last candle but the sequence of same-type candles immediately next to it, which creates a zone, thus the name "OB/ROB Zone". Not only does the tool mark those levels on the chart, but it also has a smart tracking algorithm to remove the appropriate levels dynamically. It will monitor, candle by candle, what is happening to all the OBs/ROBs, and update them according to how they are being tested/visited (eg. weak testing being a touch, and strong testing being a touch of the same colour candle).
Bullish Valley-OB:
Bearish Peak-OB:
The indicator follows our concept of "Zone Activation" to determine whether to mark zones with dashed or solid lines.
If we take a bearish Peak-OB as an example, notice how it first gets drawn with a dashed red line (as the algorithm monitors how far the price moved away from the zone):
As price moves away (distance based on our Machin Learning (ML) model), it turns into solid lines:
Some people prefer to enter market orders or limit (pending) orders close to the zone, while others wait for it to hit. You may wait for these zones to turn into solid lines (meaning that the price made a decent move away from it before revisiting it). It depends on your trading strategy.
When Order Block (OB) zones break instead of holding the ladder, they turn into what we call Reversal Order Blocks (ROB); our algorithm of flipping these zones where price could react from the other side of the OB. Our algorithm monitor and highlight the most suitable ones to trade, based on +30 conditions and variables by our Machine Learning (ML) models. Examples of ROBs in the SMC or ICT trading community are a "Breaker Block", a "Mitigation Block" or a "Unicorn Setup". However, our algorithm filters the zones based on many factors such as ratios of price movement before, inside and after these zones, along with many other factors.
The algorithm monitors the ratios of how price moved into and away from the OB/ROB, as well as the type of move happening, to then filter the ones that are considered of high probability to break/not do a reaction.
A bullish Valley-OB (green) turns into a bearish Valley-ROB (neon red) where you may short (sell), while a bearish Peak-OB (red) turns into a bullish Peak-ROB (neon green) where you may long (buy).
Example of a bullish Valley-OB that turned into a bearish Valley-ROB:
Features
Log vs. Linear scale switch to show OBs/ROBs accordingly based on the ratios and the price action around these zones (before and after creation).
Uses our Machine Learning (ML) model to determine relevant Order Blocks (OBs) to show or hide based on price action.
Considers distribution and accumulation candles to find relevant Order Blocks.
Various types of triggers to mark those Order Blocks and their zones: breakout, close, hard close (open and close) or full close (low, high, open and close).
Monitors the 1:1 expansion of price from key areas of interest, which would change the importance of the zones through our concept of “Zone Activation”.
Allows for customization in the settings to display different types of Order Blocks (e.g., tested or untested).
Marking and invalidating levels based on many variables, including single or multiple candle zones, touching/closing beyond specific levels, weak/strong testing criteria, price tolerance % (near a level), and many more.
Provides color-coded visual representation for easier interpretation.
Why is it used?
Order Blocks (OB) and Reversal Order Blocks (ROB) represent the building blocks of price ladders, in conjunction with Swing Highs and Swing Lows. By identifying where liquidity is potentially present, they become common targets for big market players. Additionally, they provide clear invalidation points based on various types of candle closes, such as hard closes or simply a candle close.
One strategy that could be used is to open positions at these OB or ROB Levels as long as the chart maintains the trend (ladder), for a potentially higher win rate (or against it for a quick scalp). Be mindful of the breaking of a ladder or the building of a new one. A ladder breaks with a hard close (open and close) of a candle across the closest two levels; a ladder builds by not breaking back down across the levels it has tested. By definition, strong ladders will have a few untested levels and come back to wick them but still retain the structure of the laddering direction (trending with Lower Lows + Lower Highs or Higher Lows + Higher Highs).
🔶 COMBINING ALL TOOLS
In summary, Trendlines could be great tools to give you a general context of whether the price is laddering up or down. Once you spot the ladder, your goal is to either trade in its direction (not to go against the trend) or to counter-trend trade (contrarian). To do so, you could use the MSB tool to spot these BOS/CHoCH. And to give you more precise entries, you may rely on the OB/ROB zones which usually mesh over the ladder, to provide a sniper entry!
🔶 RISK DISCLAIMER
Trading is risky, and most day traders lose money. The risk of loss in trading can be substantial. Decisions to buy, sell, hold or trade in securities, commodities and other investments involve risk and are best made based on the advice of qualified financial professionals. Past performance does not guarantee future results. All content is to be considered hypothetical, selected after the fact, in order to demonstrate our product and should not be construed as financial advice. You should therefore carefully consider whether such trading is suitable for you in light of your financial condition.

SMC ToolBox [WinWorld]👋 INTRODUCTION
SMC ToolBox indicator is not just a simple indicator, but rather a collection of SMC-related algorithms, that our teams has found to make the most profound impact on determination process of the most high-quality liquidity zones and points of interests ( further – POIs ), hence the name of the indicator – Tool Box (and it also sounds cool :) .
From candle patterns to complex orderflow detection algorithm, ToolBox indicator will help any trader with search for useful tools, solving the needs from confirming position entry levels to trend-following and mean reversion opportunities.
❓ WHY DID WE BUILD THIS?
This indicator was initially built for our team's internal use for the sole purpose of gathering all actively used non-structure-related algorithms* in one place, so we could have only the tools that are truly needed at hand at any point of time. After we showed this tool to our trading partners, they were surprised about how light, fast and useful ToolBox was and they advised us on sharing this with our community and, after giving it a proper thought, we decided to follow their advice.
Funnily enough , after researching TradingView's open-source script library, we haven't found even one instance of even remotely alike indicators, so it fair to say that we are one of the first people to release this kind of SMC-related indicator bundles on the market and we strongly that TradingView's community will find this tool of use.
🤷♂️ WHY SHOULD YOU CARE AT ALL?
Frankly speaking, we are not the first people to build our own algorithms of such popular indicators like Equal Highs and Lows (EQHL), Previous Day High Low (PDHL), Orderflow (OF) and etc., but we are definitely one of the first teams to implement these indicators with the help of algorithms, that are actually used by the most professional traders on YouTube and other social media trading influencers. Simply taking trades from our SCOBs, OFs, EQHLs and etc. won't print you millions overnight, but what these algos will do is help you with being aware of is potentially laying ahead of you with a very clean probability.
Why does it matter? It simple: better market awareness gives you an edge over other trades, which use old algorithms, which are clearly outdated, so beating such traders in the long run is just a game of time for you, so good algorithms do matter. Each indicator inside ToolBox is there to help you develop this market awareness and forge your edge bit by bit.
Now let's talk about what is inside the ToolBox.
🔍 OVERVIEW
At the moment of publishing ToolBox contains 8 indicators, so say "Hello" to:
Price Border Bands (further – PBB) ;
Ordeflow (further – OF) ;
Equal Highs & Lows (further – EQHL) ;
Previous Day High & Low ( further – PDHL) ;
Single Candle Order Block (further – SCOB) ;
Institutional Funding Candle (further – IFC) ;
Engulfing Candle (further – EC) ;
Inside Bars (further – IB) .
Some of them you may know, some of them you may not, so let's review each of them one by one.
📍 INDICATOR: Price Border Bands (PBB)
Price Border Bands indicator is a simple yet useful algorithm, based on Triangular Moving Average (TMA), which helps determine extreme price spikes, which on average act as meaningful mean reversion opportunities. It also is a good an effective "verifier" of POIs and zones of interest (further – ZOI) .
We advise on using this indicator this way:
Look for price going beyond upper or lower band of PBB;
Look for price reaching POI or ZOI;
Start searching for your entry point.
The most common sign of potential price reversal, which PBB searches for, is intense price spike, which signals about "liquidity clearing" or, in simple terms, manipulation .
Manipulation of the price inside the POI or price being "stopped" by POI is a screaming sign of the potentional following reversal. See the example of such situation on the screenshot below:
Additionally we need to talk about trend filter inside PBB, which colours the bars on the chart under certain conditions. If bars on the chart are being coloured in gray – this is your sign to stop trading on this asset? because there is risk to catch an uncomfortably big price spike, which might turn the '+' of your position's PnL in to '-'. See the example of PBB highlighting bar's of risky price zone in gray colour on the screenshot below:
In order to continue trading you need to wait for bars to stop being coloured in gray OR confirm the fact that price made Change of Character (ChoCh) in reverse to the previous direction of price, which was marked as risky by PBB.
And last but not least: if you see POI being reach by price inside the bands of PBB, then consider this POI weak and avoid trading it. See the example of weak POI inside PBB bands on the screenshot below:
📍 INDICATOR: Orderflow (OF)
Orderflow indicator is an algorithm, which detects Sell-to-Buy (furthert – STB) or Buy-to-Sell (further – BTS) manipulations, using the algorithm of impulse & correction price movement detection, taken from one of our previously built indicators – Impulse Correction SCOB Mapper (ICSM) .
Let's explain the terms from above:
Impulse – series of bars, each bar of which consecutively updated previous bar's high and then last candle broke previous bar's low ;
Correction – series of bars, each bar of which consecutively updated previous bar's low and then last candle broke previous bar's high ;
STB – a type of price manipulation, which can be described as a correction of price inside global upward movemnt;
BTS – a type of price manipulation, which can be describd as a impulse of price inside global downward movement.
Unlike traditional order blocks, which are often narrower and more selective, Orderflow zones cover a wider price range and present a higher probability of mitigation. This makes them more reliable for entries in ovaerage in comparison to classic orderblocks.
Let's review examples of bullish and bearish orderflows on the screenshots below:
Bullish orderflows (STBs) (blue boxes with "OF" text inside)
Bearish orderflows (BTSs) (orange boxes with "OF" text inside)
The usage of ZOIs, detected by OF algorithm, is pretty straightforward: take trades against the ordeflow block, that price has reached. Even though we don't recommend relying on Orderflow blocks as sole producers of signals, you can use them as such in way, that can be described like this:
Place stop-loss (SL) beyond the furthest border of OF block (bottom of the bullish OF or top of the bearish OF), that price has reached;
Aim for >2:1 RR ratio and place your take-profit (TP) accordingly.
You can see the example setups of OF blocks as signal producers on the screenshots below:
Examples of LONG trades, taken from price reaching bullish OF block.
Examples of SHORT trades, taken from price reaching bearish OF block.
Summarising, Orderflow can be described as a tool that helps determine the STB and BTS price manipulations, which are great price ZOIs and can be used both as confirmation tools for your exisiting signals and sole signal producers, in which case such they needed to be handled extra mindfully and preferrably bonded with other tools for additional confirmation. We personally recommend using Ordeflow as confirmation tool, because ZOIs, detected by Orderflow, are usually the price ranges, around which traders tend to place their stop-losses, which only gives more strength to these zones for supporting the price and helps traders with "trading from support/resistance" strategies gain additional edge.
📍 INDICATOR: Equal Highs & Lows (EQHL)
EQHL indicator is an algorithm, which scans the extremums of impulse and correction movements, detected by our ICSM indicator , and marks ones which are roughly or equaly placed on the same price levels. Equal highs (further – EQH) and equal lows (further – EQL) are local liquidity pools, where stop orders and resting orders cluster; price often gravitates to these zones for liquidity “top-ups,” after which a reaction or continuation to the next liquidity source may occur. Basically, EQHL algorithm highlights clusters of equal extremes as navigational anchors for “collect → react → confirm” scenarios.
Talking about usage, we advise to not take swept or reached EQHLs as entries by themselves. Evaluate them alongside HTF structure, Inducement (IDM), orderblocks (OB), orderflow (OF), candle pattern context (e.g., IFC/EC) on the LTF and etc. Intended usage scenario of this algorithm is something like this:
Price reaches EQH/EQL;
Price hangs around the reached EQH/EQL;
Another tool (for example, OF or OB) signals about price reversals from the level of reached EQH/EQL;
Trader starts looking for an entry.
See the examples of EQHLs, which algorithms maps on the chart, on the screenshots below:
Equal Lows (EQLs)
Equal Highs (EQHs)
📍 INDICATOR: Previous Day High & Low (PDHL)
PDHL indicator is an algorithm, princples of work of which can be derived from its name: algorithm tracks previous day's high and low and displays it on the chart.
Previous day's high and low are fundamental POIs in any financial market, which are traded not only by SMC traders, but by many other traders, especially by traders, which consider these POIs are one of the most crucial, because they usually highly liquidity-rich and can signal about wondeful reversal opportunities.
We expect traders to use PDHL algorithm as confirmation tool when trading by mean reversion strategies. Usage of PDHL as signal source is advised against, but traders are free to experiment nevertheless.
PDHL algorithm shows two types of PDHLs on the chart: active PDHL (solid line) and swept PDHL (dashed line) . You can the examples of PDHLs, detected by our algorithm, on the screenshot below:
📍 INDICATOR: Single Candle Order Block (SCOB)
SCOB indicator is an algorithm, which marks a very specific POIS, which are based on of the most simple yet highly profound SMC and candle pattern principles and are usually a good alternative for classic orderblocks.
Principles of SCOB detection are very simple:
Price sweeps previous candle's extremum (high/low). So called "liquidity sweep" ;
Immediately after step 1 price forms a fair value gap (FVG).
You can see basic examples of bearish and bullish SCOBs on the screenshot below:
As a matter of fact, SCOB can be used both as a confirmation tool and source of signals. However! To be a source of signals, SCOB is most suitable to be used while trading on lower timeframe (LTF), while trading on a higher timeframe (HTF) on average requires to look at SCOB as a POI rather than as independent source of signals. That being said, we would like additionally to point out, that due to the nature of SCOB being an orderblock, this tool by its nature is best suitable as confirmation tool and we expect traders to use it as such, but either way this indicator is quite multifunctional and can be used by each trader for a more specific purposes.
SCOBs, which are detected by our algorithm, are painted on the chart either as coloured candles (SCOBs without inside bars) or coloured boxes (SCOBs with inside bars) . You can see examples of SCOBs, which were detected by our SCOB algorithm, on the screenshot below:
📍 INDICATOR: Institutional Funding Candle (IFC)
IFC is a candle, which is a more strict version of SCOB. Our algorithms detects an IFC, if SCOB satisfies these conditions:
SCOB candle has large shadow (more than 50% of candle's body);
SCOB candle has large range ( | high - low | is more than a certain value, which is base on ATR).
That's basically it! Being simple as that, IFC represents itself as a high-trust SCOB, which on average has larger chance of reversing price when IFC candle is reached by it and our practice shows that it is indeed the case. IFC candles are usually go hand in hand with large price and volume spikes, which are believed to be caused by large institutional players, who trading eager to catch retail trader's stop orders, which they usually place around POIs like IFC and SCOB.
We expect traders to use IFC as a tool for entry confirmation bias, especially when considering IFC from HTF.
You can see IFC, which our algoritms detects on the chart, on the screenshot below:
📍 INDICATOR: Engulfing Candle (EC)
An Engulfing Candle is a candle, which occurs when the current candle’s body engulfs the prior candle’s body, showing a short-term shift in demand/supply balance. In SMC context, it is most useful around POIs/liquidity as a contextual confirmation element. The indicator marks bullish and bearish EC without implying a “must reverse” outcome – it’s a focus cue, not a promise.
As with any other alike tool, this algorithm should not be used as sole source of signals, but rather as a confirmation tool. ECs near support/resistance zones or POIs are typically more impactufl than those inside choppy consolidations. Structural and LTF price impulse confirmation usually enhances existing position bias in a positive way.
You can see examples of engulfing candles on the screenshots below:
Bullish engulfing candles
Bearish engulfing candles
📍 INDICATOR: Inside Bars (IB)
Inside Bars are bars, which are contained inside the range of high and low prices of the bars preceding them. This algorithm was designed to showcase periods of potential price consolidation/volatylity compression and quite often precedes price movement towards closest liquidity POIs and ZOIs. When price finally breaks out of its previous range, it usually provides good opportunities for entering trades using breakout strategies (especially ones, that are based on SMC principles) .
You can see examples of IBs, which are detected by our algorithm on the chart, on the screenshot below:
That was a long list of features, now let's talk about settings now.
🔔 WHAT ABOUT ALERTS?
At the moment of publishing this indicator includes alerts for all algorithms, which are included inside, except for Inside Bars (IB) algorithm .
⚙️ SETTINGS
At the moment of publishing most of the settings in this indicator are about styling for indicator's visuals, because by design most of the included algorithms (excluding PBB) don't rely on inputs of any technical kind. Let's review them.
ToolBox | General Styling
Text Size – (Tiny, Small, Normal, Large) – defines text size of indicator's visuals, which use text-based visuals.
Price Border Bands | Main Settings
Show Price Border Bands – toggles on/off the display of PBB;
Half Length – defines amount of bars, used for calculation of the PBB's TMA;
Price Source – defines price source for PBB's TMA;
ATR Multiplier – affects the width of PBB's bands;
ATR Period – affects the amount of bars for ATR calculation.
Orderflow (OF) | Settings
Bullish OF – toggles on/off the display & colour of bullish OF;
Bearish OF – toggles on/off the display & colour of bearish OF;
Show border – toggles on/off the display of OF blocks' border.
Single Candle Order Block (SCOB) | Settings
Show SCOB – toggles on/off the display of SCOB;
Bullish – toggles on/off the colour of bullish SCOB;
Bearish – toggles on/off the colour of bearish SCOB.
Equal High/Lows (EQHL) | Settings
Show EQH/EQL – toggles on/off the display of PDH/PDL;
EQH – toggles on/off the colour of EQH;
EQL – toggles on/off the colour of EQL.
Institutional Funding Candle (IFC) | Settings
Show IFC – toggles on/off the display of IFC;
Bullish – toggles on/off the colour of bullish IFC;
Bearish – toggles on/off the colour of bearish IFC.
Previous Day High & Low (PDHL) | Settings
Show PDH/PDL – toggles on/off the display of PDH/PDL;
Show PDH/PDL – toggles on/off the display of the past history of swept PDH/PDL;
Show previous day divider – toggles on/off the display of dashed gray line, which separates new day from previous one;
Bullish – toggles on/off the colour of bullish IFC;
Bearish – toggles on/off the colour of bearish IFC.
Engulfing Candle (EC) | Settings
Show engulfing candles – toggles on/off the display of EC;
Bullish – toggles on/off the colour of bullish EC;
Bearish – toggles on/off the colour of bearish EC.
Inside Bars (IB) | Settings
Show inside bars – toggles on/off the display of IB;
Bullish – toggles on/off the colour of bullish IB;
Bearish – toggles on/off the colour of bearish IB.
Alerts | POI
Alert Frequency – (Once Per Bar, Once Per Bar Close) – defines alert frequency of the indicator's alert for all POIs;
* all other buttons from this group of settings toggle alerts on/off.
PBB;
OF;
SCOB;
EQH;
EQL;
IFC;
PDH;
PDL;
EC.
🏁 AFTERWORD
SMC ToolBox indicator is designed to be the ultimate swiss knife, which might bring you quantifiable results when trying to crack the market's secret of where the liquidity is placed. This indicator doesn't produce any particular signals not it gives any financial advice, but it helps you deepen understanding about potential existing liquidity zones and price points by employing principles of SMC algorithms, which are most commonly used by retail traders on a daily basis.
You can view this indicator as a Christmas candy box: you pick only the candles (indicators) you need and want. We expect any trader to use this indicator by exactly same way: you should take onlt the things you need to enhance your strategy, not worrying about what to do with other indicators, fi they don't suit you.
Lastly, we would like to share our team's recommendations (they are optional, of course) on how to use certain POIs from ToolBox:
Use PBB as a filter for validating POis. Pay close attention to the rule "don't trade POIs, which are located inside the bands of PBB" (described above in "INDICATOR: PBB") ;
Use Orderflow to find short-term and mid-term trading opportunitions for trend-following strategies, using OF blocks as resistance in bearish trend and support in bullish trend;
Use EQHL and PDHL indicators when trading by mean-reversion strategies on intraday timeframes. These indicators will be especially of use to forex, stock and crypto traders;
Use SCOB and IFC indicators when trading by mean-reversion strategy to find short-term reversal opportunities;
Use ECs and IBs as confirmation/denial tools for your entry ideas. We recommend avoiding trading If price is currently going inside HTF's IB range.
We have no doubts that SMC ToolBox indicator will be of use to any trader, who employs and desire to employ SMC principles in his strategy. We will be waiting for your feedback, meanwhile you can ask your questions in the comments :)
Sincerely,
WinWorld team.

Rejection Blocks (RJB) and Liquidity Grabs (SFPs)- Milana TradesThis indicator highlights Rejection Blocks (RJB) and Liquidity Grabs (SFPs)—two advanced price action concepts used by professional traders, especially those following ICT (Inner Circle Trader) strategies.
Rejection Block (RJB) is an advanced version of the traditional Order Block. It marks areas where price has been sharply rejected—often zones where smart money enters or exits positions. The logic is based on specific wick rejection criteria and candle structure, with mitigated RJBs marked or hidden automatically.
Liquidity Grab (SFP) detects key Swing Failure Patterns—where price takes out a previous high/low, grabs liquidity, and reverses. Optional volume validation is available for more accurate filtering, especially using LTF (lower timeframe) data.
Key Features:
Rejection Block (RJB)
1) Identifies both bullish and bearish rejection blocks.
2) Two logic types: “trapped wick” and “signal wick” configurations.
3) Auto-detection of mitigated RJBs and customizable visualization.
4)Adjustable color, transparency, box style, label text, and more.
5)Limit on max RJBs displayed to keep the chart clean.
Liquidity Grab (SFP)
1)Detects bullish and bearish SFPs (Swing Failure Patterns).
2)Optional volume validation with threshold control (based on LTF).
3)Dynamically adjusts lower timeframe resolution (auto/manual).
4)Visual confirmation lines, wick highlights, and labels.
5)SFP Dashboard table (optional) for LTF & validation display.
SFP Wick to RJB Zones
Converts confirmed SFPs into new RJB boxes.
Adds powerful confluence between rejection and liquidity.
🔔 Built-in Alerts
Alerts can be set up for both bullish and bearish Rejection Blocks, as well as confirmed SFPs.
Ideal for traders who want to be notified in real-time when price:
Forms a valid Rejection Block,
Prints a confirmed SFP (Swing Failure),
Enters or exits key liquidity zones.
Alerts are fully compatible with TradingView’s alert system.
⚙️ Settings Overview:
Rejection Blocks
Enable plotting, box limit, mitigated filtering, label customization.
Liquidity Grabs (SFPs)
Enable SFPs (bull/bear), pivot length, volume % threshold, LTF resolution.
Enable dashboard, wick display, and validation logic.
SFP-based RJB
Create RJB zones from confirmed SFP signals.
Independent box length and color settings.
Dashboard & Labels
Enable/disable visual labels and LTF info table.
Customize font size, color, and position.
Use Cases:
Identify smart money rejection zones before price reversals.
Use mitigated RJBs to anticipate failed retests or structure breaks.
Trade with confidence by combining RJB + SFP signals.
Set alerts to monitor setups without staring at charts 24/7.
Notes:
Compatible with any market (Forex, Crypto, Indices, Stocks).
Works on all timeframes.

MomentumQ MS/OBMomentumQ MS/OB - Market Structure & Order Blocks Indicator
________________________________________
The MomentumQ MS/OB Indicator is a professional-grade tool designed to help traders analyze market structure, institutional order flow, and dynamic support/resistance levels.
Unlike traditional indicators, MomentumQ MS/OB leverages advanced liquidity analysis to identify key market zones, enabling traders to spot high-probability trade setups with institutional-grade precision.
A unique advantage of this indicator is its ability to generate more order blocks across all timeframes using a custom lookback setting. This feature enhances intraday order block creation, giving traders a clearer view of market liquidity shifts in lower timeframes while remaining effective in higher timeframes.
Additionally, the dynamic support and resistance plotting system automatically adjusts based on market structure, ensuring traders have a real-time, adaptive view of key price levels. Unlike static support/resistance indicators, these dynamic zones shift based on price action, helping traders identify breakouts, retests, and liquidity traps more accurately.
________________________________________
Key Features
1. Market Structure & Institutional Order Blocks
Detects institutional bullish and bearish order blocks, helping traders locate high-liquidity zones.
Real-time zone updates keep traders focused on the most relevant price levels.
Generates more order blocks in every timeframe, making it ideal for intraday and long-term trading strategies.
2. Smart Dynamic Support & Resistance Detection
Uses historical price action to identify high-impact support and resistance zones dynamically.
Updates automatically in response to price action, keeping traders focused on valid trading zones.
Helps traders anticipate breakouts, reversals, and liquidity traps in real time.
3. Institutional-Grade Price Action Analysis
Advanced algorithmic validation filters weak order blocks, ensuring only the strongest setups are displayed.
Customizable settings allow traders to adjust the indicator’s sensitivity based on their trading style.
4. Professional-Level Charting & Customization
Fully adjustable visuals – Traders can toggle features such as:
Bullish/Bearish Order Block Zones
Boundary Lines
Market Structure Levels
________________________________________
How It Works
Institutional Order Blocks
The indicator scans for swing highs/lows and detects liquidity zones based on institutional price movements.
Bullish Order Blocks indicate where institutions accumulated buy orders.
Bearish Order Blocks indicate where institutions placed aggressive sell orders.
The lookback setting enhances detection, allowing traders to see more order block formations across multiple timeframes.
Market Structure & Dynamic Support/Resistance
The algorithm continuously evaluates price action and key rejection levels, dynamically adjusting support and resistance zones.
Unlike traditional static support and resistance levels, these zones shift with real-time market conditions.
Helps traders determine trend direction and anticipate market reversals.
Order Block Validation
Only high-probability order blocks are displayed, eliminating weak signals and providing stronger trade opportunities.
The indicator produces more order blocks at lower timeframes, allowing for better intraday trade execution insights.
________________________________________
How to Use This Indicator
Confirm institutional trading areas by analyzing bullish and bearish order block zones.
Use dynamic support and resistance levels to identify high-probability trade zones for breakouts and reversals.
Adjust the lookback setting to control the frequency of order block detection, optimizing for intraday vs. long-term trading strategies.
Combine with price action strategies to validate trade entries and exits using breakouts, retests, and rejection signals.
This indicator works for all markets, including Forex, Stocks, Crypto, Futures, and Commodities.
Supports multiple timeframes, making it suitable for scalping, swing trading, and position trading.
________________________________________
Why Is This Indicator Valuable?
Unlike traditional indicators that only plot support/resistance or trend-based signals, MomentumQ MS/OB provides a complete institutional-grade trading system:
Advanced Order Block Detection – Not just generic support and resistance, but real institutional footprints.
Smart Market Structure Recognition – Tracks trend shifts before they happen.
Adjustable Lookback Feature – Generates more order blocks on lower timeframes for precise intraday trading.
Dynamic Support and Resistance Zones – Adapts in real-time, ensuring accurate trade setups.
Customizable and Professional-Grade – Suitable for traders looking for high-probability setups.
________________________________________
Example Trading Strategies
1. Order Block & Break of Structure (BoS) Confirmation
Wait for price to break structure near an institutional order block.
Enter on the first retest of the order block for a high-probability trade setup.
Set stop-loss behind the order block and target the next key level.
2. Using Dynamic Support & Resistance for Reversal Trades
If price reaches a dynamic resistance level, wait for bearish confirmation such as a rejection wick or engulfing candle.
Enter short with stop-loss above resistance and target the next dynamic support level.
Works for long trades at dynamic support levels as well.
________________________________________
Disclaimer
This indicator does not guarantee profits and should be used as part of a complete trading strategy. Past performance is not indicative of future results.

BTC InsightThis script is a comprehensive tool for analyzing Bitcoin's daily price range, trend predictions, and significant volume-based order block levels. It combines multiple technical analysis concepts, including exponential moving averages (EMAs), logarithmic calculations, and custom indicators for advanced forecasting and visualization.
Key Features and Technical Details
1. Exponential Moving Averages (EMAs)
The script calculates two smoothed EMAs:
EMA1 and EMA2 are derived from the logarithmic price of Bitcoin (log(close)).
The smoothing periods and multipliers are user-configurable through inputs:
Smoothed EMA1 Period (default: 728)
Smoothed EMA2 Period (default: 728)
Initial EMA Multipliers (default: 1.0 for EMA1, 5.0 for EMA2)
A time decay factor is applied to the multipliers to adjust sensitivity over time, making the EMAs adaptive to market dynamics.
2. Logarithmic Domain Calculations
The script uses logarithmic transformations to enhance accuracy when dealing with large price changes.
Adjustments to EMAs are made in the logarithmic domain and converted back to the price domain for plotting.
3. EMA Forecasting
The script performs a linear regression analysis over a specified period (728 bars by default) to estimate future price trends for both EMAs.
Slope Adjustments:
RSI (Relative Strength Index) is incorporated to modify the forecast slope dynamically:
RSI > 70: Bearish adjustment (-0.5)
RSI < 30: Bullish adjustment (+0.5)
Forecasts are plotted as dashed lines, projecting future values of EMA1 (green) and EMA2 (red).
4. Order Block Detection
Detects order block levels based on high volume spikes relative to the average volume over a lookback period (default: 100 bars).
A volume multiplier (default: 1.5x) is applied to identify significant volume activity.
Two types of order blocks are identified:
Below EMA1: A price zone where significant buying occurred below EMA1.
Above EMA2: A price zone where significant selling occurred above EMA2.
Order blocks are visualized as shaded rectangles:
Green boxes represent order blocks below EMA1.
Red boxes represent order blocks above EMA2.
5. Customization Inputs
The script allows fine-tuning via the following parameters:
EMA Settings: Periods, multipliers, and time factors for both EMAs.
Volume Analysis Settings: Lookback period and volume multiplier for order block detection.
Order Block Box Settings: Height of the range as a percentage of the detected price.
6. Visualization
EMAs: Two smoothed exponential moving averages are plotted with configurable offsets.
Forecast Lines: Dashed lines project future EMA trends based on regression analysis.
Order Block Boxes: Highlight areas of high volume below EMA1 and above EMA2, indicating potential support or resistance zones.
How It Works in Practice
EMAs and Trend Analysis:
The EMAs represent long-term market trends, adjusted dynamically using custom multipliers and time decay.
The script forecasts the EMAs' future trajectories to anticipate potential price movements.
Order Blocks:
High-volume zones indicate areas where significant market activity occurred, providing insights into potential price reversal points or continuation zones.
RSI Integration:
RSI-based slope adjustment fine-tunes the EMA forecast, adding an extra layer of dynamic market context.
Comprehensive View:
By combining trend forecasts with volume-based zones, the script delivers a robust analysis tool for identifying potential entry/exit points, support/resistance levels, and long-term trend predictions.
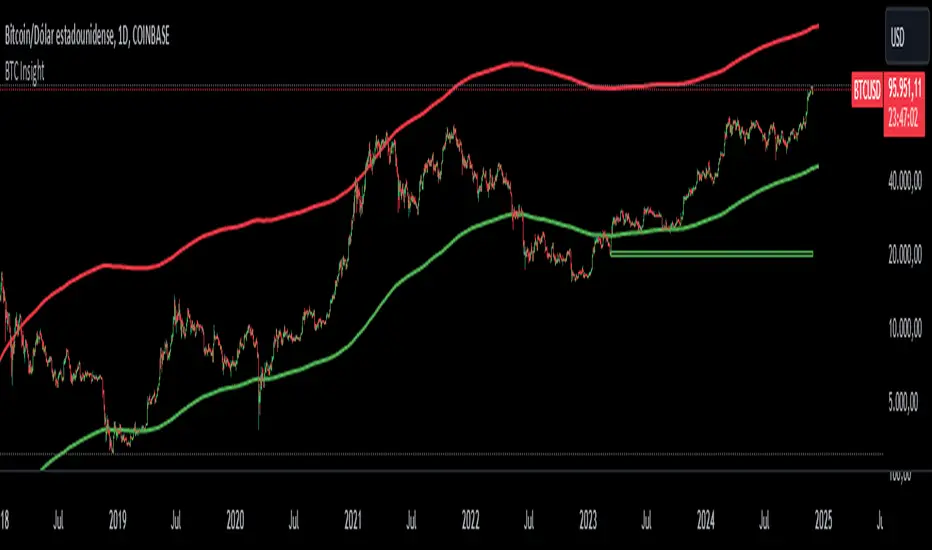
IMGPro - V1.0IMG PRO uses nine sequential stages to analyse price action and alert users to potential Trade Setups using various Price Action Concepts as detailed below:
1. Identify Higher Timeframe Market Structure and Points of Interest (HTF-POIs)
2. Calculate position size based on your risk appetite, fees and account leverage and customisable maximum trade risk
3. Verify price is in a premium or discount
4. Determine Lower Timeframe Market Structure Break Type
5. Apply Early Warning Systems if enabled
6. Alert you to risk managed trade setups at enabled HTF-POIs
7. Alert you to unentered trade invalidations
8. Alert you to trade exits based on your set criteria
9. Provide Additional Alerts such as Higher Timeframe SFPs and Market Structure Breaks that act as potential early warnings that a trade setup may be forming
1. HTF POIs Available with IMG PRO:
a. HTF Market Structure Range Highs and Lows
b. HTF Order Blocks
c. HTF Order Blocks & FVG Overlaps
d. HTF Breakers
e. HTF Breakers & FVG Overlaps
f. HTF FVGs
g. Internal Liquidity Levels
These levels are used for Trade Signals based on user settings applied. Details provided in the trade setup section below
a. Higher Timeframe Market Structure Range High and Low through Multiple Timeframe Analysis:
Market Structure can be defined using several techniques. The IMG indicators employ the Close through High/Low technique, which necessitates a candle to close through a structural level to validate a structural break and designate a new range.
Example: H12 Market Structure visualisation on a H12 Chart with annotations:
By selecting a particular Market Structure timeframe in the settings, the indicator immediately illustrates both current and historical market structures for the chosen timeframe across all subordinate timeframes, subject to the limitations of your Tradingview subscription.
Example: H12 Market Structure visualisation on a H1 Chart with annotations:
b. Higher Timeframe Order Blocks
An Order Block represents the last candle of the opposite direction preceding a Market Structure Break. For instance, a bullish Order Block is identified as the final bearish candle leading to a bullish market structure break, and vice versa for bearish Order Blocks.
Example: H12 OB visualisation on a H12 Chart with annotations:
When activated, the indicator will highlight the Higher Timeframe Order Blocks responsible for a Market Structure Break on all subordinate timeframes relative to the chosen Market Structure Timeframe.
Note: if multiple OBs exist, the indicator will display the OB closest to the new range extreme
Example: H12 OB visualisation on a H1 Chart with annotations:
c. HTF Order Blocks & HTF FVG Overlaps
When enabled, the IMG Pro will only display overlaps of Order Blocks and FVGs. These are strong points of interest to look for trade setups
Example of the indicator displaying a Higher Timeframe’s (HTF) OBs + FVGs on a Lower Timeframe (LTF) chart:
The upper chart labelled H12/H12 is the indicator displaying H12 Structure and OB+FVGs on a H12 chart.
The lower chart labelled H12/H1 is the indicator displaying H12 OB+FVGs on a H1 chart:
d. Higher Timeframe Breakers
A Breaker Block is identified as the most recent Order Block that has been breached by price, leading to an opposite Market Structure Break. For example, a bullish Breaker Block is the last bearish Order Block that price has passed through, confirming a bullish structural break, and the inverse is true for bearish Breakers.
Example: H12 Breaker visualisation on a H12 Chart with annotations:
Once enabled, the system will display Higher Timeframe Breaker Blocks after an opposite Market Structure Break is confirmed on all subordinate timeframes.
Example: H12 Breaker visualisation on a H1 Chart with annotations:
e. HTF Breakers & HTF FVG Overlaps
When enabled, the IMG Pro will only display overlaps of Breakers and FVGs. These are strong points of interest to look for trade setups
Example:
The upper chart labelled H12/H12 is the indicator displaying H12 Structure and Breakers+FVGs on a H12 chart
The lower chart labelled H12/H1 is the indicator displaying H12 Breakers+FVGs on a H1 chart
f. Higher Timeframe Fair Value Gaps (FVGs)
A Fair Value Gap is a concept used by price action traders to identify market inefficiencies, where buying and selling are not balanced. It appears on a chart as a triple-candle pattern, with a large candle flanked by two others whose highs and lows do not overlap with the large candle, creating a gap. This gap often attracts the price towards it before the market resumes its previous direction.
Example of the indicator displaying a Higher Timeframe’s FVGs on a Lower Timeframe (LTF) chart:
-The upper chart labelled H12/H12 is the indicator displaying H12 Structure and FVGs on a H12 chart.
-The lower chart labelled H12/H1 is the indicator displaying H12 FVGs on a H1 chart
g. HTF Internal Liquidity Levels (FVGs)
A HTF Liquidity Level is a Higher Timeframe three bar Pivot that forms inside an active range.
When enabled, the system will display all UNTESTED HTF pivots formed within an active range. Lines will stop extending once they are either tested or HTF Market Structure Breaks
Example: H12 Liquidity Levels on a H1 Chart:
2. Risk Management and Position Sizing:
a. Automated Position Sizing:
The System will automatically calculate position size based on the account size, max leverage and risk appetite (capital risk per trade) details input in settings. Calculated trade details are included in the Tradingview Alerts as well as interactive labels on the charts.
Details include but are not limited to:
Trade Timeframe
Side: Long/Short
Type: Limit/Market
Position Size in $ and Units
Lot sizes if applicable
Trade Risk %
Take Profit Level
Entry Price
Stoploss Price
b. Maximum Trade Risk:
IMG PRO has the ability to invalidate potential trade entries if it exceeds your maximum Trade Risk threshold. Trade Risk is the % price difference between entry and stoploss.
When an invalid signal is generated, the signal will not be shaded and the interactive label will display the reason for invalidation
In the example below, Max Trade Risk is set to 2% , but the trade signal had a trade risk of 5.11% invalidating the signal with a grey triangle
3. Verify Premium / Discount:
The system can be setup to only display signals that are in the top or bottom n% of the Market Structure Range
A value of 0 (default) will disable the premium/discount system and utilize the entire range for all signal types (bullish and bearish)
EXAMPLES:
A value of 50% will only display bullish signals that have, at minimum, tagged the bottom half of the range and vice versa for bearish signals.
A value of 25% will only display bullish signals that have tagged the bottom quarter of the range and vice versa.
A value of 38.2% will display signals that tag the top and bottom 38.2% of the range (equivalent of the 61.8% OTE. retracement) Etc.
4. Determine Lower Timeframe Market Structure Break Type
IMG Pro has two options for Lower Timeframe Structure Breaks:
Market Structure Breaks: When selected, the system will use the first opposite pivot (in the current chart timeframe) to the left of a confirmed SFP to calculate a break in market structure when price closes through it:
Market Structure Shifts: When selected, the system will use the first opposite pivot (in the current chart timeframe) to the left OR right of a confirmed SFP to calculate a break in market structure when price closes through it. MSS’ are more sensitive and may provide more false signals but are useful when there are big spike liquidity runs:
5. Apply Early Warning Systems if enabled:
The IMG Pro indicator has an early warning system that will generate a potential setup alert before a HTF SFP is confirmed
There are two types of early warnings:
LTF Structure Break Early Warning:
If enabled, the system will generate a potential setup alert if price cuts through a HTF level (Range Extreme / Internal Liquidity) and prints an opposite LTF MSB back through that level. This is a more aggressive approach where the system does not wait for the HTF SFP to be confirmed.
Example: In the screenshot below, the system did not wait for a H12 SFP to be confirmed, allowing it to signal an entry that would have otherwise been missed if the LTF Structure Break early warning system was not enabled
LTF FVG Early Warning:
If enabled, the system will generate a potential setup alert if price cuts through a HTF level (Range Extreme / Internal Liquidity) and prints an opposite LTF FVG back through that level. No LTF MSB is required and a limit order at the FVG is signalled. This is a more aggressive approach where the system does not wait for the HTF SFP to be confirmed.
Example: In the screenshot below, the system did not wait for a H12 SFP to be confirmed, signalling an entry as soon as an opposite LTF FVG is confirmed pushing price back through the HTF Liquidity Levels
6. Trade Setup Types Available with IMG PRO:
The system will alert you to potential trade setups at these HTF POIs: .
a. Higher Timeframe (HTF) Swing Failure followed by a Lower Timeframe (LTF) MSB at Range Extremes
b. Higher Timeframe (HTF) Swing Failure followed by a Lower Timeframe (LTF) MSB at enabled HTF POIs
c. Higher Timeframe (HTF) Swing Failure followed by a Lower Timeframe (LTF) MSB at All Internal Liquidity Levels (With Trend and Counter Trend)
d. Higher Timeframe (HTF) Swing Failure followed by a Lower Timeframe (LTF) MSB at All Internal Liquidity Levels (With Trend ONLY)
e. Lower Timeframe (LTF) Swing Failure followed by a Lower Timeframe (LTF) MSB at enabled HTF POIs
f. Multiple LTF Entry Options once a signal is confirmed
a. HTF Swing Failure followed by a LTF MSB at Range Extremes
A Swing Failure Pattern (SFP) is a technical analysis concept used in trading to identify potential reversals in price trends. It occurs when the price attempts to surpass a previous high or low but fails to sustain that level, indicating a possible change in market direction. There are multiple methods to define a SFP but this indicator uses the failure to close through a Key Level. When confirmed, HTF SFPs will be displayed on-screen and an alert will fire if enabled.
Example: EURUSD H12 Trade Setup Alerts at Range Extremes on a H1 Chart:
Alerts to Enter at Lower Timeframe MSBs
When enabled, a potential trade setup label and alert will generate when a HTF SFP is confirmed at a Range Extreme followed by a Chart Timeframe (Lower Timeframe) Market Structure Break (MSB). These signals are agnostic to current Market Structure bias and will generate at both extremes.
b. HTF Swing Failure followed by a LTF MSB at HTF POIs:
When enabled, a trade setup label and alert will generate when a HTF SFP is confirmed at an enabled Higher Timeframe POI (Order Blocks / Breakers / FVGs) followed by a Chart Timeframe (Lower Timeframe) Market Structure Break (MSB). These signals are always in line current Market Structure bias.
Example: H12 SFPs and Trade Setups at HTF POIs with Fluid Exits on a H1 Chart:
c. HTF Swing Failure followed by a LTF MSB at All Internal Liquidity Levels ( With Trend and Counter Trend ):
When enabled, a trade setup label and alert will generate when a HTF SFP is confirmed at an Internal Liquidity Level followed by a LTF Market Structure Break (MSB) or Market Structure Shift(MSS). These signals are agnostic to HTF Market Structure bias and will alert to setups with and counter trend.
Example:
d. HTF Swing Failure followed by a LTF MSB at All Internal Liquidity Levels ( With Trend ONLY )
Same as (c), but will only signal trades that are in line with higher timeframe structure. I.e If HTF Structure is bullish, then only bullish trades will be signalled.
e. LTF Swing Failure followed by a LTF MSB at enabled HTF POIs
The system will alert you to a lower timeframe setup if these conditions are met inside enabled HTF POIs (OBs / Breakers / FVGs):
- LTF SFP
- LTF MSB
Example:
f. LTF Entry Options:
IMG PRO provides the following options for LTF Entries:
i. Limit Entry at MSB Level
ii. Limit Entry at Breaker
iii. Limit Entry at Raid Candle
iv. Limit Entry at OTE 70.5% Retracement
v. Market Entries (where applicable)
Trade entry alerts will detail limit entry prices based on the option selected here.
7. Unentered Trade Invalidations:
IMG Pro can invalidate unentered signals based on these custom criteria:
a. Opposite HTF SFP Before Entry
b. TP Hit Before Entry
c. Confirmed Opposite Signal Before Entry
If enabled and criteria met, the system will alert you to cancel any limit orders for the trade that is being invalidated.
8. Trade Exit Types Available with IMG PRO:
The system provides the following options for trade exit alerts:
a. Exit at Fixed R:R
b. Exit at a confirmed Opposite Signal (Fluid Exits)
c. Exit at enabled and untested HTF POIs
d. Exit on an opposite HTF SFP at a liquidity level
Example: H12 SFPs and Potential Trade Setups at Internal Liquidity Levels with Exit at closest untested HTF POI on a H1 Chart:
9. IMG PRO Alerts Overview
The system provides notifications of:
a. Confirmed HTF Market Structure Breaks
b. Confirmed HTF SFPs at Range Extremes
c. Confirmed HTF SFPs at HTF POIs
d. Confirmed HTF SFPs at Liquidity Levels
e. Potential Trade Setups at Range Extremes
f. Potential Trade Setups at HTF Points of Interest
g. Potential Trade Setups at HTF Liquidity Levels
h. LTF SFPs inside HTF POIs
i. Potential LTF Setups at HTF POIs
j. All Exit Types including Stoplosses
k. All Trade Invalidations
To enable alerts, right-click on the indicator and select “Add Alert on IMG ...”. You may customise the alert name as desired and then click 'Create' to finalise the alert setup.
General Note:
There is no system, indicator, algorithm, or strategy that can provide absolute certainty in predicting market movements. Use trading indicators as a tool to assist with trading decisions; manage your risk wisely.
Stay safe and Happy Trading!